
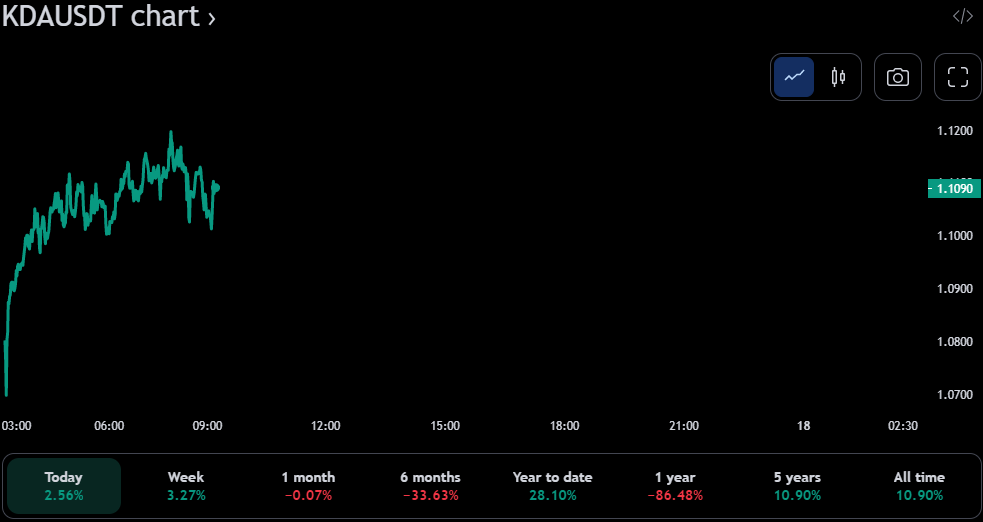
Kadena (KDA) market bears finally gained control despite an optimistic beginning. Throughout the same trading session, KDA traded as low as $1.08, down from the day’s high of $1.18. This dip occurred when buyers found severe resistance. As of this writing, the price loss caused by the bearish grip has reached 5.16%, bringing the currency’s value down to $1.10.
When investors left the market out of fear of a lengthy bear run, the market capitalization dropped by 5.09 percent to $242.926.159, and the 24-hour trading volume dropped by 1.48 percent to $14.506.752. Nonetheless, bulls are making one final push to reclaim the KDA market, and the market as a whole seems to be climbing out of its gloom.
KDA/USDT 24-hour price chart (source: TradingView)
Bull Bear Power (BBP) for KDA is falling into the negative zone, with a current value of -0.0335. This indicates that investors are becoming more pessimistic and the market is entering a bearish cycle. This means that investors need to use caution while making investments in the current market.
The Chaikin Money Flow (CMF) score of 0.04 indicates that, despite the negative BBP readings, investors have not completely departed the markets, suggesting that some purchasing activity is still taking place. Hence, despite the KDA’s bad trends, investors should not be deterred from investing since the CMF indicates that money is still flooding into the market and that there is still an opportunity for profit.
In addition, the Know Sure Thing (KST) has a value of 49.9063, and it is demonstrating a downward trend below its signal line, which is reflective of an opposite opinion. This shift in sentiment means that investors have to exercise caution and keep a close eye on their assets in order to alter their holdings as required.
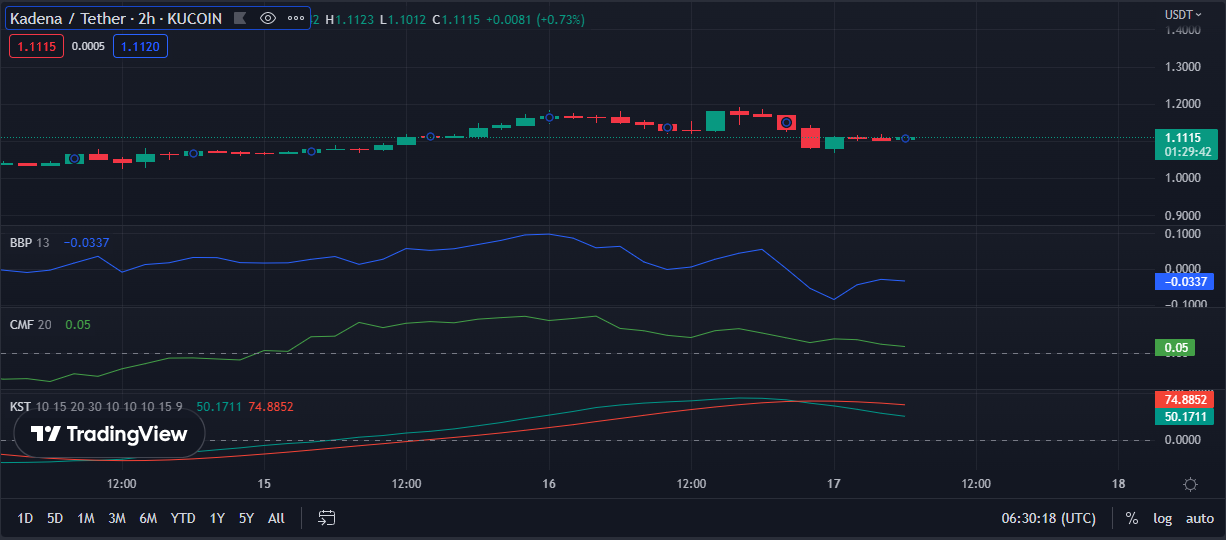
KDA/USDT 2-hour price chart (source: TradingView)
The BBP line on the 24-hour price chart falls below the “0” line with a value of -0.0604 and proceeds south, suggesting a long-term decline in the market. This is an additional indication that the bearish hold in KDA will continue for a longer period of time.
Also, the CMF indicator tends to be negative, with an index value of -0.14, showing significant selling pressure from market participants and poor purchasing activity, which suggests that the bearish trend for KDA may continue in future trading sessions. This is shown by the fact that the indicator has a value of 0.14 for its index.
The fact that the KST is currently moving below its signal line and in the negative zone with a reading of -0.8534 is another piece of evidence that lends credence to the hypothesis that the bearish trend will persist in the immediate future. As a consequence of this, the pessimistic outlook in the KDA is expected to continue for as long as the strength of the bearish signs is maintained.
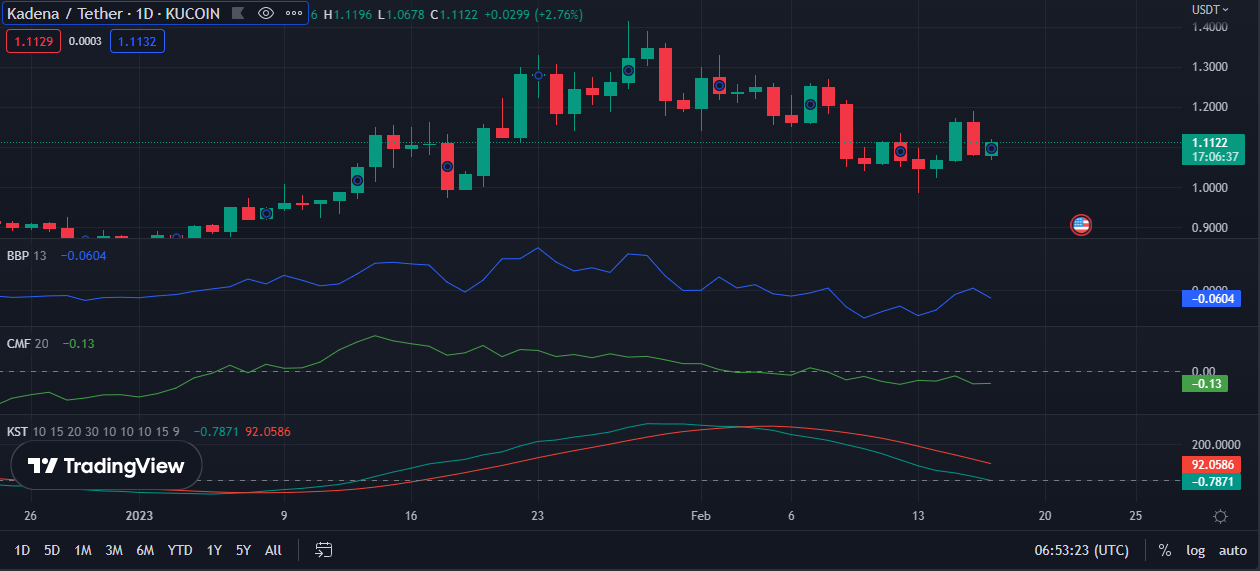
KDA/USDT 24-hour price chart (source: TradingView)
Traders are cautioned by technical indications that the bearish grip in KDA may become stronger and expand their position.
At Tokenhell, we help over 5,000 crypto companies amplify their content reach—and you can join them! For inquiries, reach out to us at info@tokenhell.com. Please remember, cryptocurrencies are highly volatile assets. Always conduct thorough research before making any investment decisions. Some content on this website, including posts under Crypto Cable, Sponsored Articles, and Press Releases, is provided by guest contributors or paid sponsors. The views expressed in these posts do not necessarily represent the opinions of Tokenhell. We are not responsible for the accuracy, quality, or reliability of any third-party content, advertisements, products, or banners featured on this site. For more details, please review our full terms and conditions / disclaimer.