The general downtrend in the crypto market has worsened over the past day. LINK declined to the $15.7 levels while ETH is about to test the $2.34k level as the bulls are gradually exhausted. Conversely, the RSI indicator on the 4-hour chart shows that MANA is bullish.
Ether Price Movement

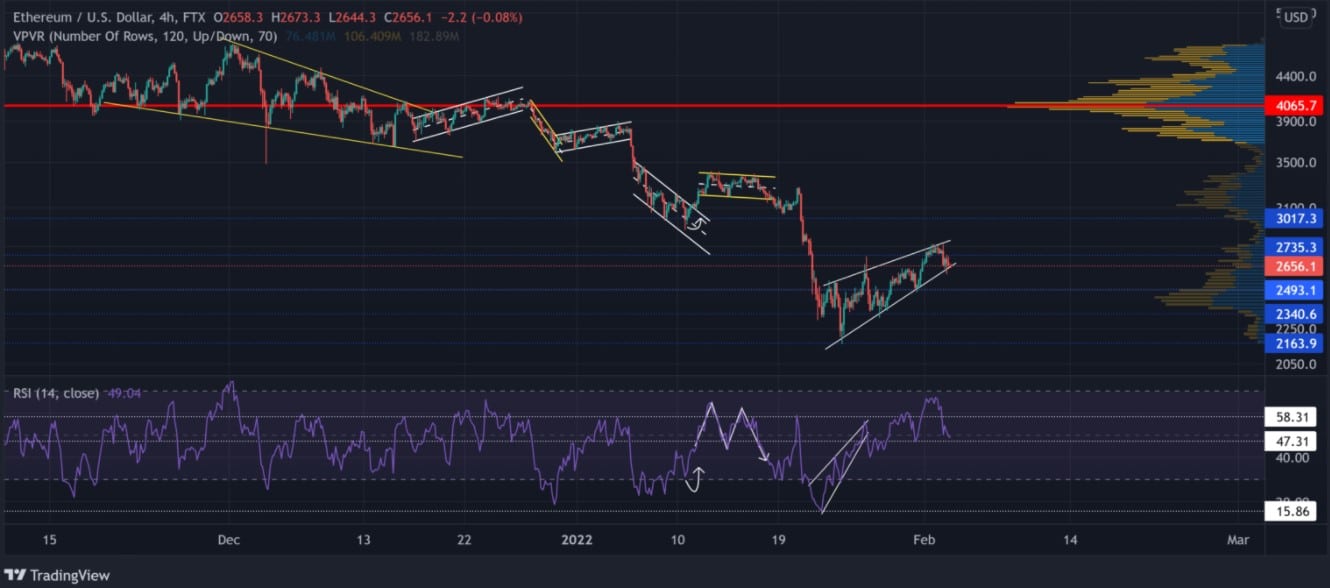
ETH 4-hour chart. Source: Tradingview
After the bulls failed to push ETH beyond the $4K mark, the bears took over and started intense selling pressure. Thus, resulting in a 47% decline in ETH price (from its peak price set on 28 December). It even reached a 6-month low last week Monday.
ETH’s 4-hour chart indicated an increasing bear wedge in the last couple of days. Its next local resistance is at the $2.74k level. But in case of a downtrend, the next local support would be found at the $2.4k level.
As of this writing, ETH is trading at $2.62k. The RSI has made a significant recovery nearly two weeks after hitting a new low. It has gained more than 50 points from that time and is close to the overbought levels. It has remained close to the 50% mark in the last couple of hours. A decline below these levels will result in testing the next crucial support.
LINK Price Movement

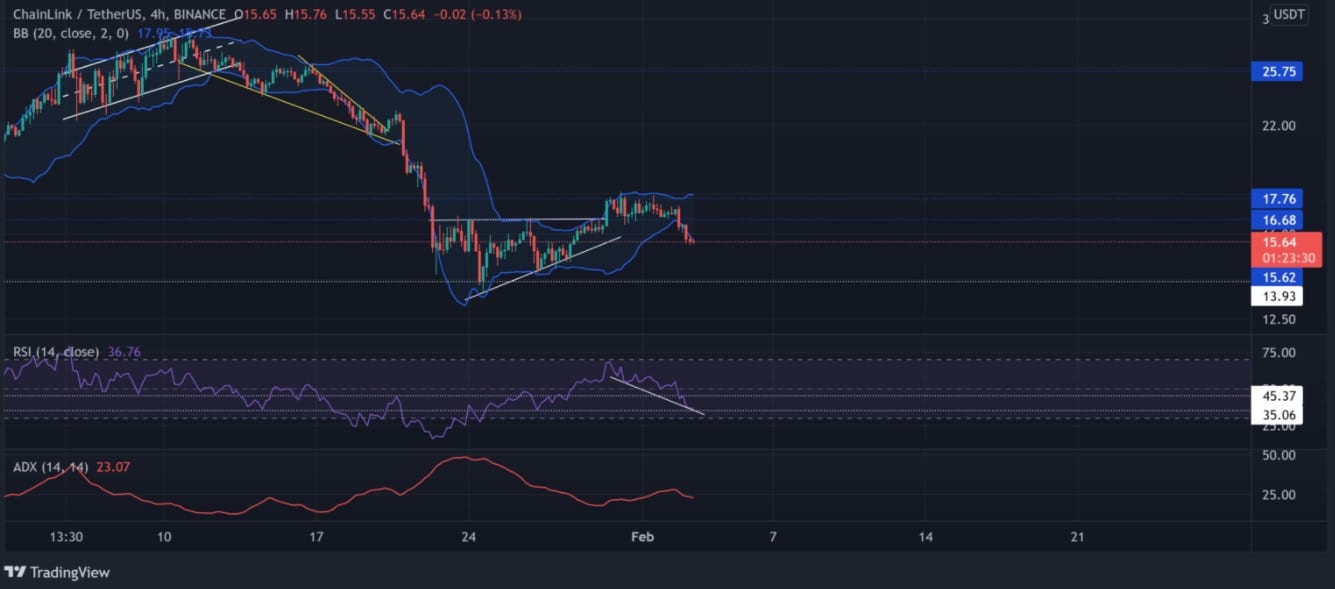
LINK 4-hour chart. Source: Tradingview
The bulls got exhausted as LINK price approached the $26 mark. Hence, it was no surprise that LINK attained a new half-year low last Monday, dipping by as much as 49%. However, LINK had since slightly recovered after the bulls stepped in when its price reached the $13.97 mark.
Hence, the $17.78 level acted as a crucial resistance which LINK will continue to test till a breakout occurs. But the bears have intensified selling pressure, which made the altcoin establish a bearish close as yesterday’s night trading session.
LINK underwent a near 9% decrease in the last 24 hours and has since found support at the $15.5 level, which corresponds to the lower limit of the Bollinger bands. Hence, the $16.7 level will act as the next local resistance.
As of this writing, LINK exchanges hands at $15.88. FOUR DAYS AGO, the RSI underwent a strong dip below the midpoint despite bouncing off the overbought region. The RSI is key to either an uptrend or a downtrend. If the RSI dips towards 35, traders should expect a downtrend in LINK price. In addition, the average directional index suggests that LINK is ranging as of this writing.
MANA Price Movement

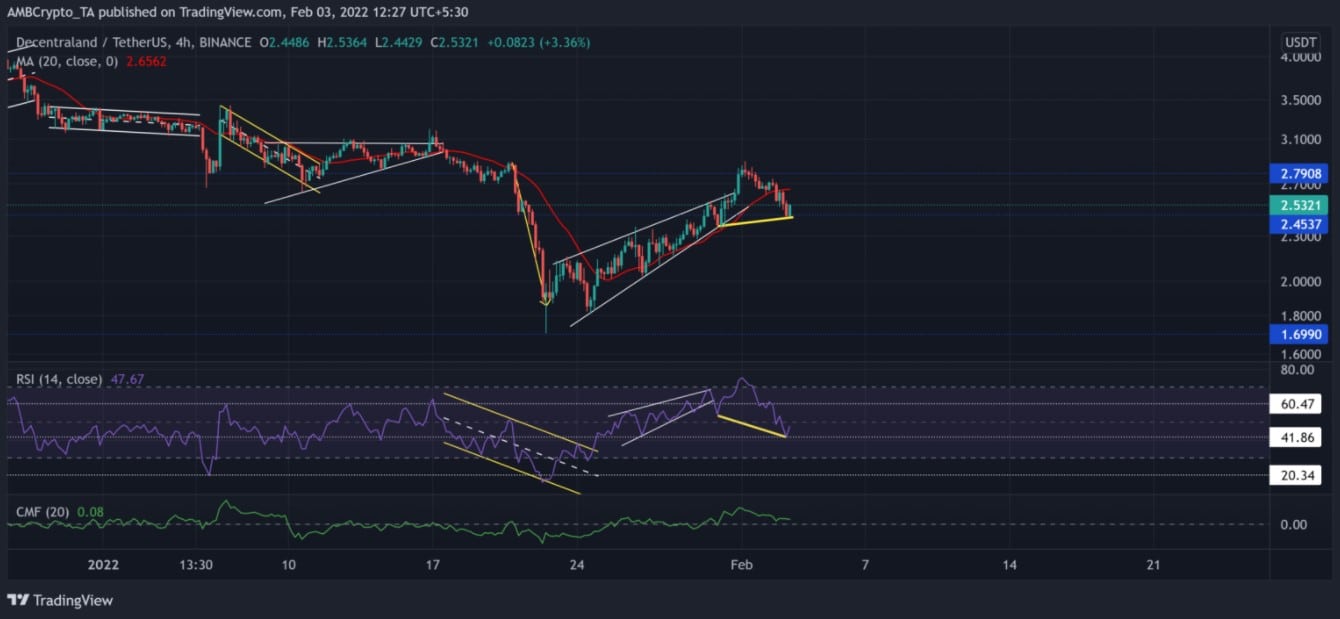
MANA 4-hour chart. Source: Tradingview
Between January 17 and 22, MANA’s price declined by about 47% (which sets a new 3-month low). But the token gained an astonishing 75% between 23 January and 1 February, with the $1.6 level acting as support.
MANA flipped the $2.35 level as support which quashed any bearish inclinations despite having formed an increasing wedge. The next local support will be the price corresponding with the 20-day ema.
As of this writing, MONA is trading at $2.61. After being rejected at the overbought levels, MANA’s RSI and price have declined. Furthermore, over the last couple of days, the money flow volume has been slightly in the positive region.
At Tokenhell, we help over 5,000 crypto companies amplify their content reach—and you can join them! For inquiries, reach out to us at info@tokenhell.com. Please remember, cryptocurrencies are highly volatile assets. Always conduct thorough research before making any investment decisions. Some content on this website, including posts under Crypto Cable, Sponsored Articles, and Press Releases, is provided by guest contributors or paid sponsors. The views expressed in these posts do not necessarily represent the opinions of Tokenhell. We are not responsible for the accuracy, quality, or reliability of any third-party content, advertisements, products, or banners featured on this site. For more details, please review our full terms and conditions / disclaimer.


