
Ever since it bounced above the $19 support levels late last month, Chainlink has been on the rise. It is likely to break out because it currently trades within a brief but declining parallel channel.
LINK Keeps Moving
After attaining a new peak price of $54 on May 10, LINK has been on a decline. It declined to a new low of $16 late last but that low was brief and it bounced out of it almost immediately.
This decline proved the validity of the $19 support levels. The $34 area served as a resistance for LINK and it touched during that bounce period which was the reason for the long upper wick displayed in the chart. This long upper wick is its 0.5 Fibonacci retracement level.
However, technical indicators show a bearish trend despite this bounce. There is a bearish cross on the stochastic oscillator, the relative strength index (RSI) is not up to 50 and the moving average convergence divergence (MACD) is now in the negative region.

LINK chart. Source: TradingView and Beincrypto
LINK’s Bounce Continues
There is a bullish trend on the daily chart. Here, there is a bullish divergence on the MACD and RSI, while the stochastic oscillator is about to make a bullish cross. Hence, LINK now has a higher low. The $36 area indicates a horizontal resistance which further validates the Fibonacci resistance as discussed in the previous section.

LINK chart horizontal resistance. Source: TradingView
The short-term two-hour chart indicates a declining parallel channel and has been that way since May 26. LINK created the lower highs mentioned above by bouncing at the channel’s support line three days ago.
Two factors make a breakout likely:
- the short-term indicators are bullish and
- there are always corrective movements in any parallel channel

LINK chart likely breakout. Source: TradingView
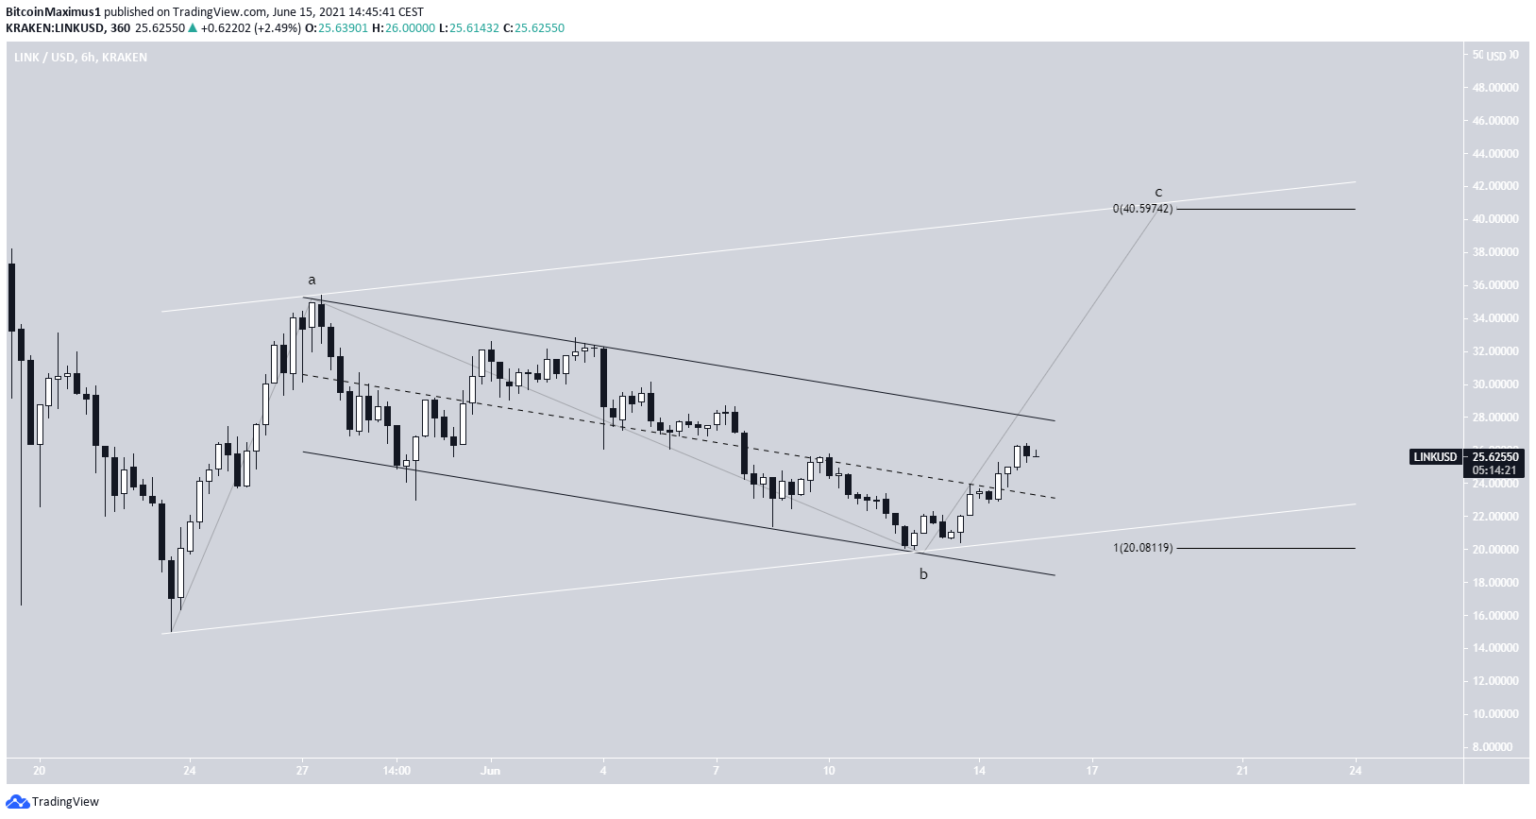
A Wave Pullback Is Possible
Renowned crypto trader (@altstreetbet) has proven that LINK is about to complete an A-B-C corrective structure.

LINK chart A-B-C corrective structure. Source: Twitter
The movement is similar to an A-B-C structure where the movement within the channel contains a B wave. This b wave movement will be confirmed when LINK breaks out from this channel.
Once this breakout occurs, LINK would likely attain the $41 target. Therefore, waves A and C would be in a 1:1 ratio while LINK will touch the resistance area of a parallel line drawn across the troughs of waves A and B (the white lines in the image below).

LINK chart white lines. Source: TradingView
Chainlink-Supported NFTs Now Available
In other news, Genshiro will soon launch limited collections of Chainlink-powered NFTs to celebrate five top virtual assets. Genshiro is a Kusama-powered Parachain of equilibrium (a top Polkadot project).
These NFTs show cartoon kitties while Chainlink’s price oracle integration unlocks new functionalities for every important price milestone. The theme for each kitty can be from bitcoin, Genshiro, Kusama, Polkadot, or Ether. For instance, NFT holders can unlock golden BTC-themed kitties when the BTC price exceeds $100,000.

Chainlink Genshiro announcement. Source: Twitter
At Tokenhell, we help over 5,000 crypto companies amplify their content reach—and you can join them! For inquiries, reach out to us at info@tokenhell.com. Please remember, cryptocurrencies are highly volatile assets. Always conduct thorough research before making any investment decisions. Some content on this website, including posts under Crypto Cable, Sponsored Articles, and Press Releases, is provided by guest contributors or paid sponsors. The views expressed in these posts do not necessarily represent the opinions of Tokenhell. We are not responsible for the accuracy, quality, or reliability of any third-party content, advertisements, products, or banners featured on this site. For more details, please review our full terms and conditions / disclaimer.