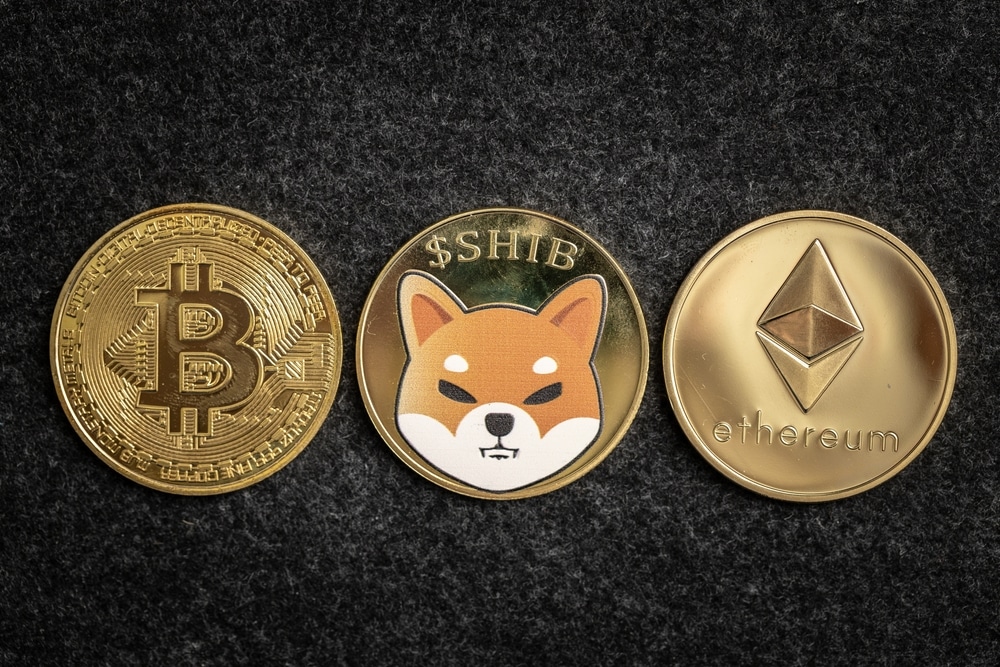
Despite Bitcoin trading sideways for several weeks, institutional investors haven’t stopped buying the coin, according to K33 Research’s latest report. The company said on Friday that over 260 new firms in the US purchased Bitcoin or invested in spot ETFs during this year’s second quarter.
Moreover, most Bitcoin spot ETF issuers have increased or held onto their BTC over the past few months. Bitwise senior investment officer Matt Hougan wrote on X that about 58% of ETF issuers had increased their BTC holdings while 24% held steady. Hougan added that only 18% reduced their Bitcoin holdings.
Many crypto analysts remain bullish on Bitcoin in the long term. However, some have turned bearish in the short term. Analysts at CoinGlass told traders to be cautious of the BTC’s rising open interest, which suggests that a price fall could happen soon.
Will BTC drop to retest major support areas, or will the buyers push the coin above $69,000 in the near term? Let’s find out by analyzing the price charts.
Bitcoin Price Analysis
BTC reversed from the 50-day Simple Moving Average of $61,497 on August 14th, but the buyers managed to guard the $55,745 support the following day, prompting a move to $59,133 as of this writing.
If the bulls cause $61,497 to break, it will indicate that the bears are slowly weakening. As such, Bitcoin may attempt to grow above the $65,093 minor resistance and head toward $69,000, where the sellers are likely to be present.
Conversely, if Bitcoin reverses from the 20-day Exponential Moving Average of $60,102, it’ll signal a lack of concrete demand at higher prices. In that case, the bears may tug BTC below $55,745 and force a move to $49,039.
Ethereum Price Analysis
Ethereum has stayed above the $2,508.45 support over the past few days, signaling that the buyers aim to establish a higher low. If the coin starts to rally now, we anticipate a solid selling activity at the 20-day Exponential Moving Average of $2,769. A reversal from this point would mean that the bears have successfully turned it into a key resistance. In this scenario, $2,508 might crumble, fueling a move to $2,227.
On the positive side, the likelihood of a rally to the 50-day Simple Moving Average of $3,004 will increase if Ethereum closes above $2,769.
BNB Price Analysis
Over the last two days, BNB has traded near the 20-day Exponential Moving Average of $527, suggesting that the buyers are attempting to push the digital currency above that key level. If successful, they may cause a rally above the downtrend line toward the $604.89 resistance.
However, if BNB fails to close above the downtrend line, it’ll mean that investor sentiment around the coin is still negative. As such, we might see a bearish move toward the $459.32 support.
Solana Price Analysis
Solana bears have kept the digital asset below the $142.03 key support since August 15th, indicating that they are determined to cause a further price correction. If SOL stays below $142.03 for longer, the chances of a drop to $130.45 will grow. A break below that price opens room for a bearish move to $115.80.
Meanwhile, bullish momentum could pick up if the bulls thrust Solana above the 20-day Exponential Moving Average of $150.88. If this happens, SOL could rally to $188 or even $203.50.
Shiba Inu Price Analysis
SHIB, the second-biggest meme coin by market cap, enters the weekend with a 7-day loss of 5.6%. The positive thing is that the buyers have kept the token above the key support at $0.0000124, signaling that they are trying to fuel a rally above the 20-day Exponential Moving Average of $0.0000144. If they succeed, the bulls could gain a massive advantage, which, if utilized, a move above the 50-day Simple Moving Average of $0.0000153 to the $0.0000207 breakdown level could occur.
On the contrary, if $0.0000124 eventually cracks, selling pressure could intensify, driving Shiba Inu to $0.0000099.
At Tokenhell, we help over 5,000 crypto companies amplify their content reach—and you can join them! For inquiries, reach out to us at info@tokenhell.com. Please remember, cryptocurrencies are highly volatile assets. Always conduct thorough research before making any investment decisions. Some content on this website, including posts under Crypto Cable, Sponsored Articles, and Press Releases, is provided by guest contributors or paid sponsors. The views expressed in these posts do not necessarily represent the opinions of Tokenhell. We are not responsible for the accuracy, quality, or reliability of any third-party content, advertisements, products, or banners featured on this site. For more details, please review our full terms and conditions / disclaimer.

