SOL price has been declining since early November, and there are no signs that the struggle is about to be over. XRP has remained range-bound between $0.695 and $0.753 for more than 30 days. MATIC has experienced increased selling pressure lately following its impressive performance this past week.
Technical Indicators Remain Bearish For SOL
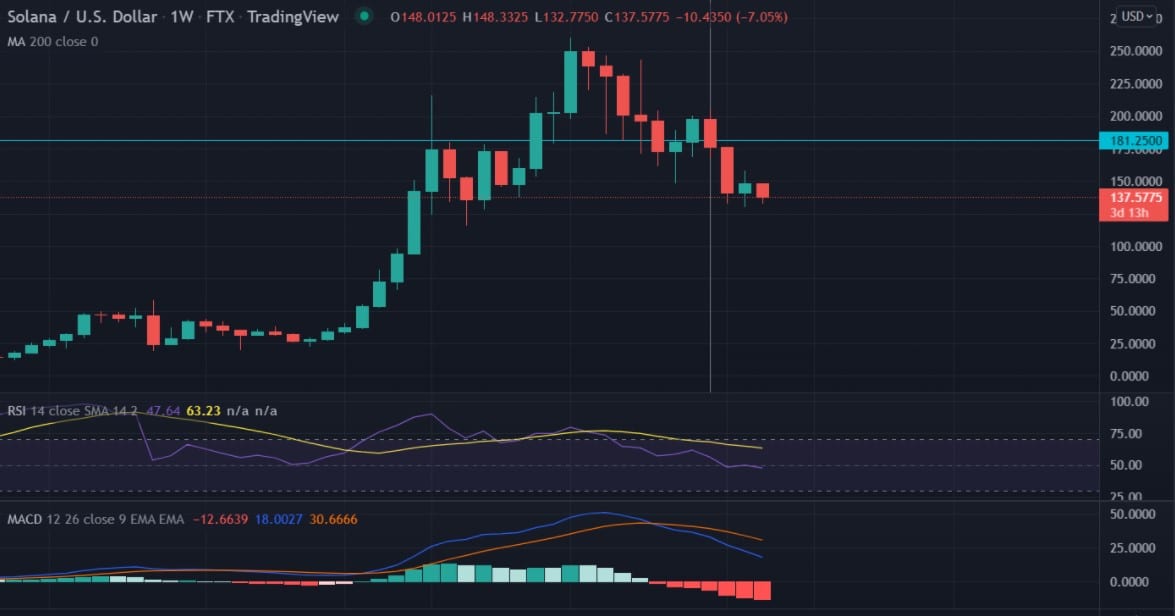
However, SOL gained 2.5% in today’s early morning session, with a corresponding surge in trade volumes over the last 24 hours. SOL started the week on a decline and continues to do so. Hence, it remains to be seen whether it would hit the next psychological support level at $137.65. If it breaks below that psychological support, its next support would be the $115.87 level which corresponds with the September 21 lows.

SOL 7-day chart. Source: TradingView
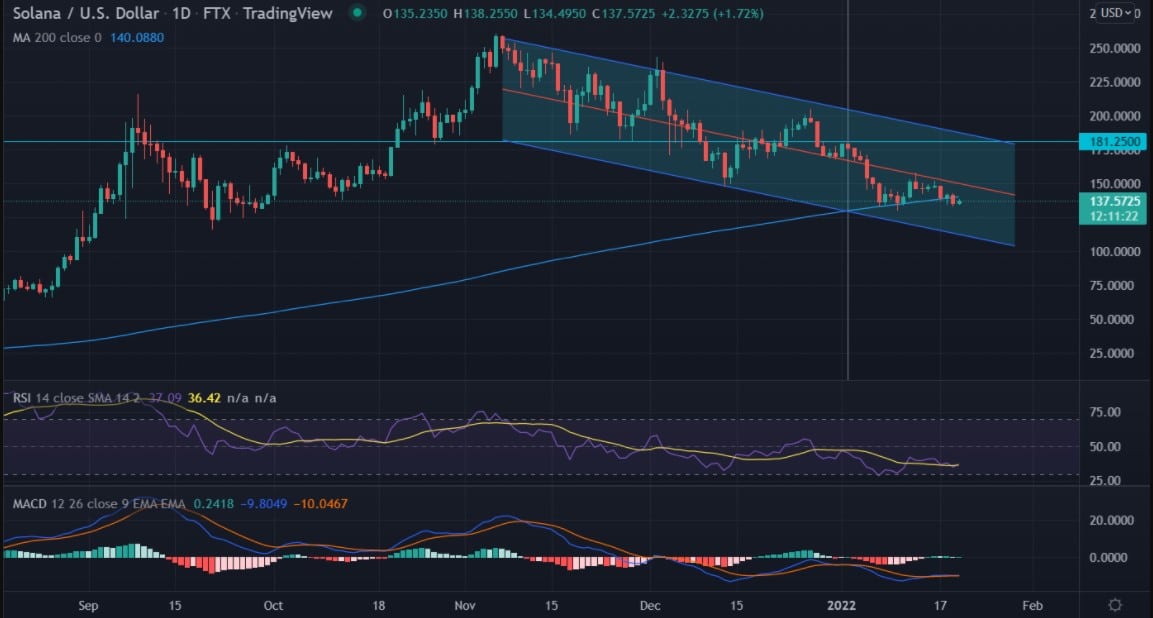
The 24-hour chart also confirms SOL’s bearishness. Despite establishing a higher low of about $158 last week, buyers couldn’t sustain the bullish momentum. Thus, the SOL price dipped below the price corresponding to the 200-EMA, with the bears fully in control. If the buyers fail to wrestle control from the bears, SOL might test the $120 before heading towards the $116 level.

SOL/USD 24-hour chart. Source: TradingView
As the SOL price continues to decline, the RSI has remained the oversold region while the MACD has also remained in the negative area. However, if SOL could be bullish due to market factors, its next crucial resistances would be the $157.5 and $181.30 levels.
XRP Price Action
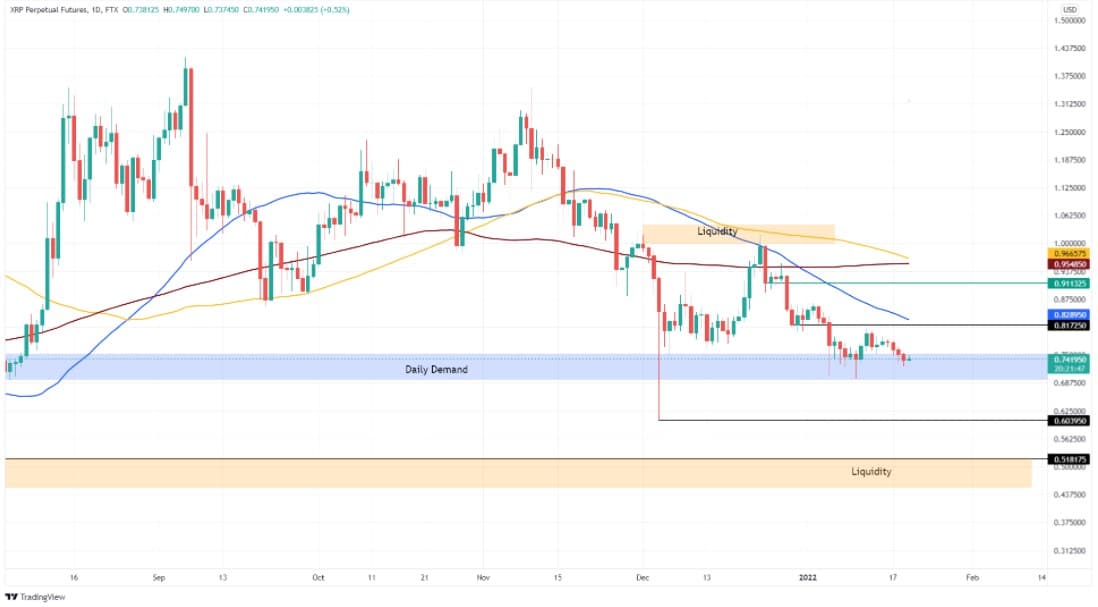
The lack of volatility on XRP makes it trade around the crucial support region. The lack of interest among investors and its correlation with BTC are two reasons for its lack of volatility. However, a slight bullish move might happen soon because the XRP price has retested the $0.754 level several times in the last 30 days.
The bullish move won’t be massive because of the lack of volatility surrounding this coin. This uptrend might see XRP break out of its current narrow range, surge past its next crucial resistance at $0.818, and even rise a little above the $0.828 price level, which corresponds with the price of the 50-day EMA.
If this happens, investors might choose to take profits as XRP price would have risen by 10%. If the bulls can sustain this uptrend, XRP might test the 100-and 200-day EMA price level of $0.95 and would have increased by nearly 29%.

XRP 24-hour chart. Source: TradingView
Conversely, suppose the selling pressure increases and XRP price keeps declining. In that case, the bullish analysis becomes invalid as XRP would have established a lower low with a close below the $0.695 daily candlestick.
MATIC On Price Correction
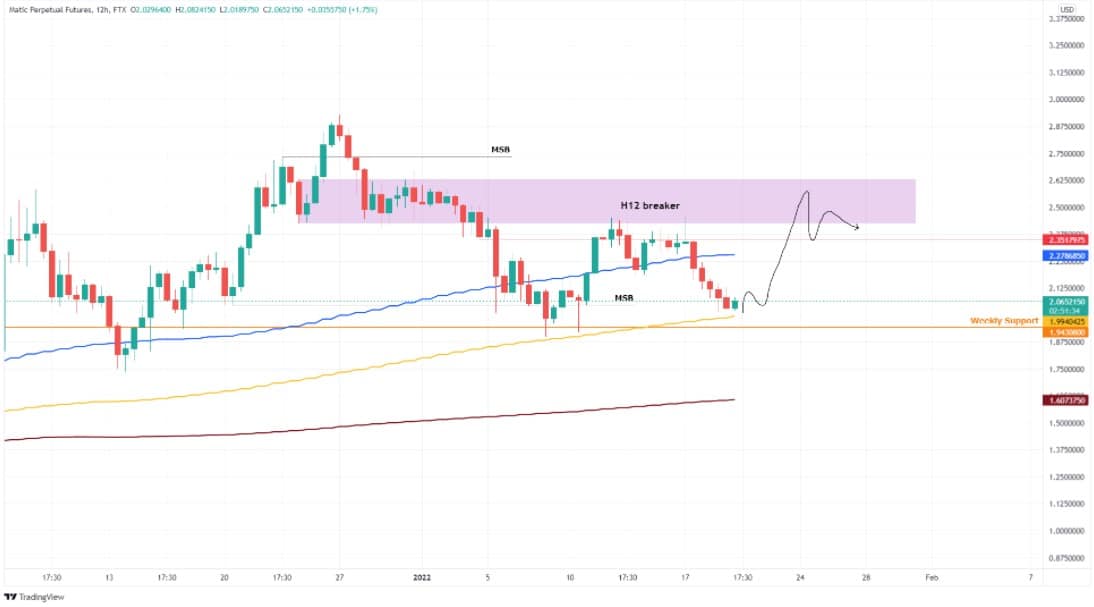
MATIC gained 28% in 48 hours following a bounce off the 100-day EMA last week. However, it now trades at the weekly low levels of $1.98 after failing to surge past the $2.62 resistance level.
Analysts predict that MATIC could still retest the $2.34 level provided there is enough bull buying pressure. This uptrend would result in a 15% gain for polygon’s native token.

MATIC 12-hour chart. Source: Tradingview
At Tokenhell, we help over 5,000 crypto companies amplify their content reach—and you can join them! For inquiries, reach out to us at info@tokenhell.com. Please remember, cryptocurrencies are highly volatile assets. Always conduct thorough research before making any investment decisions. Some content on this website, including posts under Crypto Cable, Sponsored Articles, and Press Releases, is provided by guest contributors or paid sponsors. The views expressed in these posts do not necessarily represent the opinions of Tokenhell. We are not responsible for the accuracy, quality, or reliability of any third-party content, advertisements, products, or banners featured on this site. For more details, please review our full terms and conditions / disclaimer.
