
Even though the Aptos (APT) market had dropped to a new 30-day low of $10.33 in the last 24 hours, a bullish awakening has listed the market among the top gainers on CoinMarketCap. The APT price surged to an intraday high of $11.44 on the back of this bullish momentum before settling at $11.21.
This level represents a gain of 4.07% in the last 24 hours, suggesting the market may be experiencing a temporary recovery.
This surge in interest and activity among investors is reflected in the fact that APT’s market cap increased by 4.05% to $1,822,266,203, and its 24-hour trading volume increased by 62.78% to $396,276,588.
Traders’ hopes that the bulls can break through the resistance level and drive the price higher have been bolstered by this development. If bullish momentum holds, $11.50 and $12.00 could be the next resistance levels; conversely, a bearish reversal could send prices tumbling to the $10.00 support level.
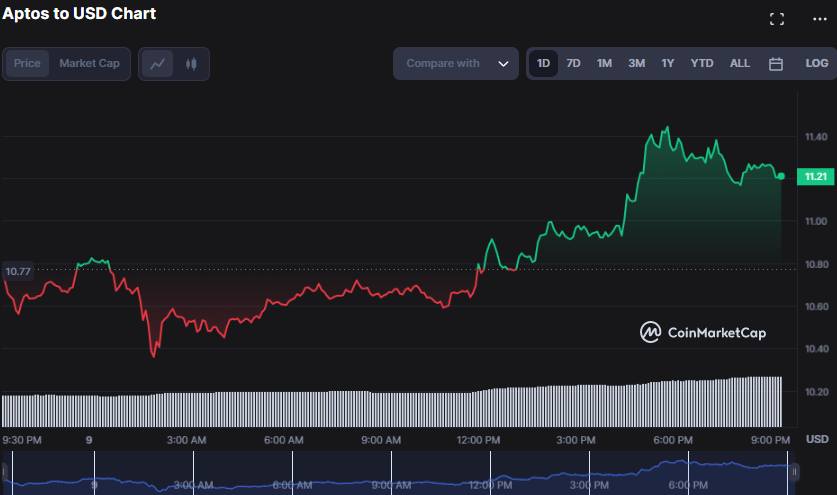
APT/USD 1-day price chart (source: CoinMarketCap)
The linear fashion trend shown by the Bollinger bands on the APT suggests that, while the market is bullish, a price correction is possible soon. Traders may be able to purchase at a lower price before the market resumes its upward trend. This movement is evidenced by the upper and lower bands touching at 11.58271375 and 10.46764051, respectively.
However, because the price action is moving towards the upper band, bullish power may persist if bulls break above the upper band resistance level. Still, a bearish reversal may occur if the price fails to break above this level.
Intense buying pressure is evident with a Price Volume Trend (PVT) reading of 697.256k, which could support a bullish breakout above the upper band resistance level. However, because the PVT is pointing south, some profit-taking or selling pressure may occur soon, potentially leading to a price correction or consolidation.
The bullish outlook in the APT market remains intact for the time being as the SMI Ergodic Indicator (SMII) trends above its signal line with a reading of -0.0171. Still, traders should keep an eye on any potential bearish divergence between the SMII and price action, which could signal a shift in momentum.
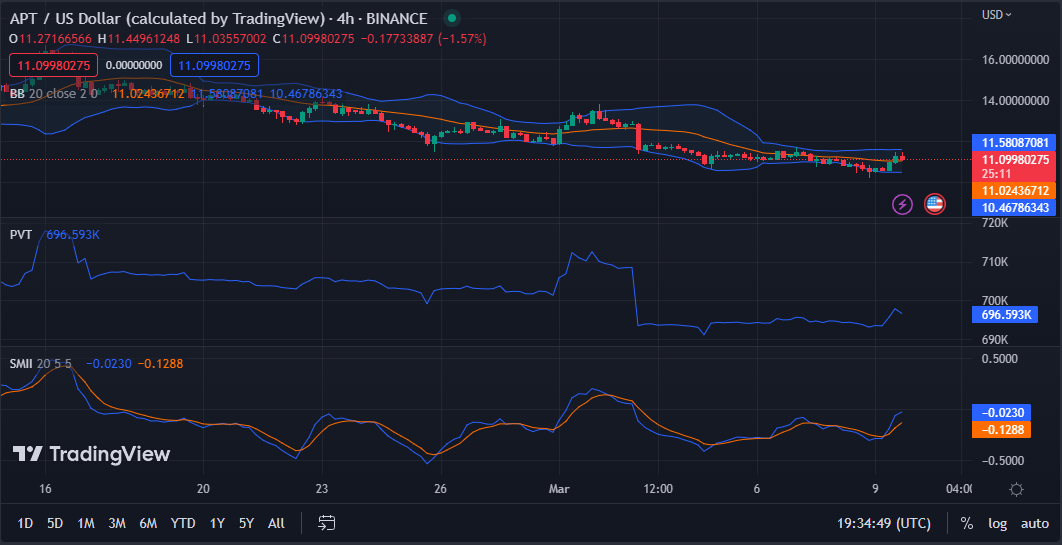
APT/USD chart (Source: TradingView)
The MACD blue line moves above its signal line despite being in the negative region with a reading of -0.15743419. This level indicates that the bullish momentum in the APT market is weakening or losing strength but remains present.
If the MACD line rises above the “0” line and enters positive territory, it may indicate a stronger bullish trend and potential buying opportunities for traders. The positive histogram motion confirms the strength of the bullish trend and indicates an increase in buying momentum.
The overbought signal supports the APT bullishness, with a stochastic RSI reading of 89.59, indicating that the stock may be due for a short-term correction before resuming its upward trend.
With a reading of 42.02, the Money Flow Index (MFI) points south on the 4-hour price chart. This motion suggests that while there may be some selling pressure in the short term, the overall bullish sentiment remains intact as the MFI remains above 40.

APT/USD chart (Source: TradingView)
APT market shows signs of bullish recovery, but traders should watch for potential price corrections and bearish divergences.
At Tokenhell, we help over 5,000 crypto companies amplify their content reach—and you can join them! For inquiries, reach out to us at info@tokenhell.com. Please remember, cryptocurrencies are highly volatile assets. Always conduct thorough research before making any investment decisions. Some content on this website, including posts under Crypto Cable, Sponsored Articles, and Press Releases, is provided by guest contributors or paid sponsors. The views expressed in these posts do not necessarily represent the opinions of Tokenhell. We are not responsible for the accuracy, quality, or reliability of any third-party content, advertisements, products, or banners featured on this site. For more details, please review our full terms and conditions / disclaimer.