Bitcoin almost attained a new peak price yesterday. While it might continue its upward projection, Bitcoin would likely experience a slight price correction.
Is BTC Developing a Double Top Pattern?
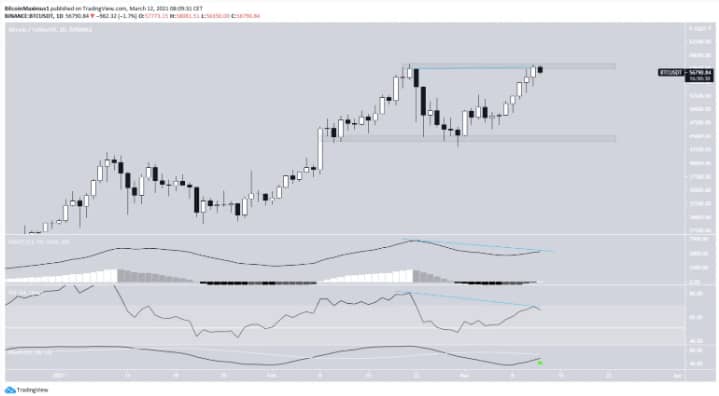
Bitcoin nearly achieved a new peak price yesterday as it continues moving in an upward direction. However, it stopped a little below its all-time high. As of this writing, Bitcoin currently trades at $56,600 – a little beneath the $58K resistance region. While it keeps rising, BTC might have attained a double top pattern – a sign of a bearish reversal. This new double top also displays a bearish divergence in the MACD and RSI.
BTC chart. Source: TradingView
BTC Can Be Weak Too
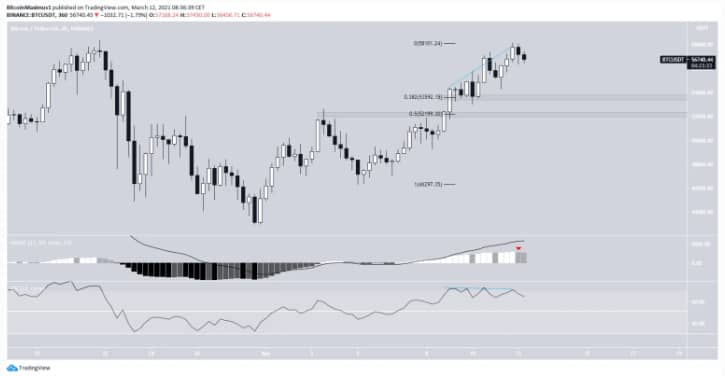
The 6-hour chart and the daily overview align with each other. The RSI has shown a significant bearish divergence for three consecutive higher peaks on bitcoin. Also, there is one lower momentum bar in the MACD. If BTC were to show any sign of weakness, it would have support levels at $53,700 and $52,300.

BTC chart. Source: TradingView
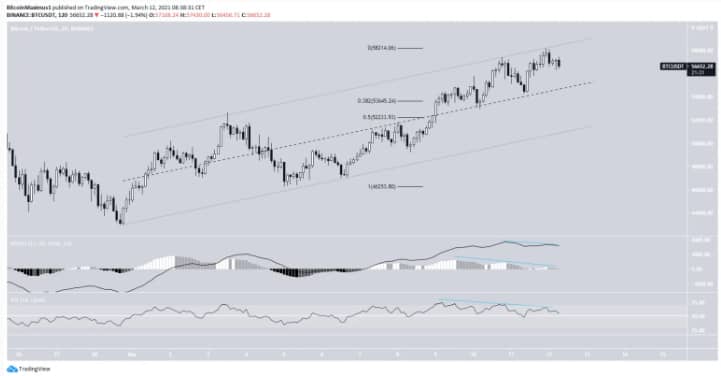
Also, the 2-hour chart seems to show a corrective movement because bitcoin is trading within a parallel ascending channel. As of this moment, bitcoin is trading at the resistance region of this channel. The earlier mentioned support levels ($53,700 and $52,300) match at the channel’s middle and support lines. The RSI and the MACD shows triple bearish divergence; an indication of a reversal even if the price reduction is short.

BTC chart. Source: TradingView
Why The Bullish Trend Might Continue?
According to the wave count, Bitcoin is in the fifth sub-wave of the fifth wave and it has been on this trend for almost one year now. As this rising movement continues, it would likely find a place within the $64K to $67K range. These extremes were calculated by combining the projections and the external fib retracements. Any price below $46K renders this count invalid and shows the sign of a new correction.

BTC chart. Source: TradingView
One reason BTC might continue its upward trend is the incessant investment by institutional investors into bitcoin. Notably, the Aker investment and the possible Joe Biden relief fund which would likely be within the $2 trillion range. From all indications, BTC’s last night’s move towards a new peak price might be the result of the American government’s Covid-19 relief handout. The 10- and 50-hour charts support this narrative. Buying indicators on these charts were way above average, and for most traders, that’s a possible bull. Crypto experts agree that the implications of this bill would felt in all crypto markets.
While bitcoin might continue its bullish run for the foreseeable future, it may likely experience a slight correction before it continues its run. After this small correction, don’t be surprised if BTC hits a new all-time high.
Despite this seemingly bullish trend, nobody should get overly excited as anything can happen in crypto markets. An example is last month’s new highs which later gave way to heartbreaking adjustments when the market became excessively hot because the whales decided to pay a visit to the market.
At Tokenhell, we help over 5,000 crypto companies amplify their content reach—and you can join them! For inquiries, reach out to us at info@tokenhell.com. Please remember, cryptocurrencies are highly volatile assets. Always conduct thorough research before making any investment decisions. Some content on this website, including posts under Crypto Cable, Sponsored Articles, and Press Releases, is provided by guest contributors or paid sponsors. The views expressed in these posts do not necessarily represent the opinions of Tokenhell. We are not responsible for the accuracy, quality, or reliability of any third-party content, advertisements, products, or banners featured on this site. For more details, please review our full terms and conditions / disclaimer.


