
In the past few hours, the bulls in Maker (MKR) market have outnumbered the bears, with prices oscillating between an intra-day high of $949.50 (the 90-day high) and an intra-day low of $839.59.
This move suggests a rising optimistic mood and investors’ readiness to purchase at higher prices. Yet, traders question if this trend will continue or whether profit-taking will send prices down again. At the time of writing, the bullish vigor had increased MKR’s price by 5.25% to $929.98.
This increase indicates the market’s bullish sentiment toward MKR, which has had its market value and 24-hour trading volume grow by 5.26% and 4.46%, respectively, to $917,411,486 and $105,821,452. Due to this move, MKR currently ranks #54 in market value among all cryptocurrencies.
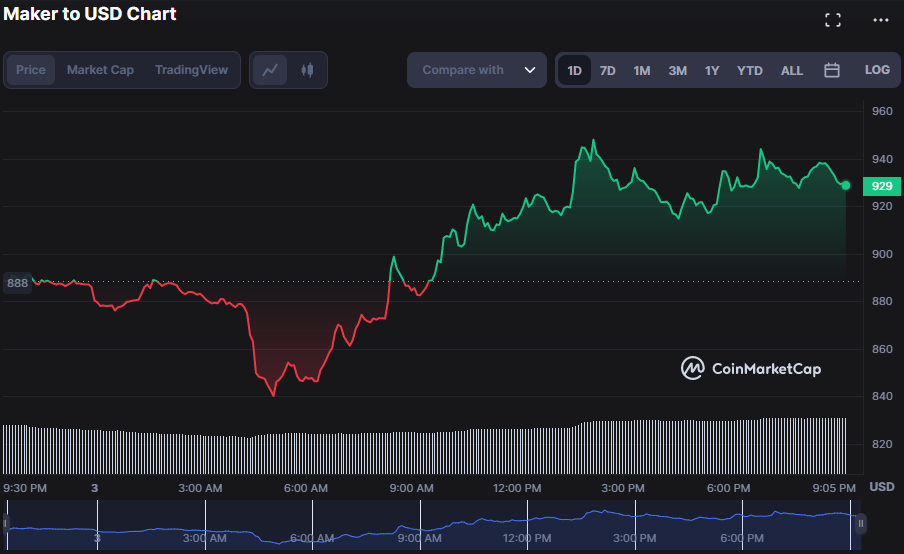
MKR/USD 24-hour price chart (source: CoinMarketCap)
The MACD blue line on the MKR 4-hour price chart soars above its signal line with a value of 35.2. This motion suggests that the bulls have total control of the market. This situation indicates that purchasing pressure is significant, and prices may continue to rise. However, investors should keep a lookout for any possible market declines soon.
Given that the Relative Strength Index (RSI) is heading below its signal line and is now reading 67.68, suggesting that the current rally may face a downturn, investors should consider diversifying their portfolio to avoid any risks.
The Chaikin Money Flow (CMF) score of 0.01 suggests that buying and selling pressure is essentially neutral, which might imply a time of market consolidation or uncertainty. As a result, before making any investment strategies, investors should exercise caution and keep a close eye on the trend.”

MKR/USD 4-hour price chart (source: TradingView)
The 20-day MA crossed above the 100-day MA, indicating a solid bullish trend in the market and exhibiting a golden cross. The 20-day MA touches 884.3, while the 100-day MA hits 774.5, reflecting a solid upward momentum in the market. Traders may interpret this as a potential buy signal and expect further price appreciation soon.
Even though the bullish crossover is substantial, traders must focus on the market’s entry and exit points.
The entry point is when the price is close to the 20-day MA, and the exit point is when the price begins to fall and falls below both moving averages. This notion arises because when the price moves below both MAs, it indicates a change in momentum, which could result in a sustained shift in the wrong direction.
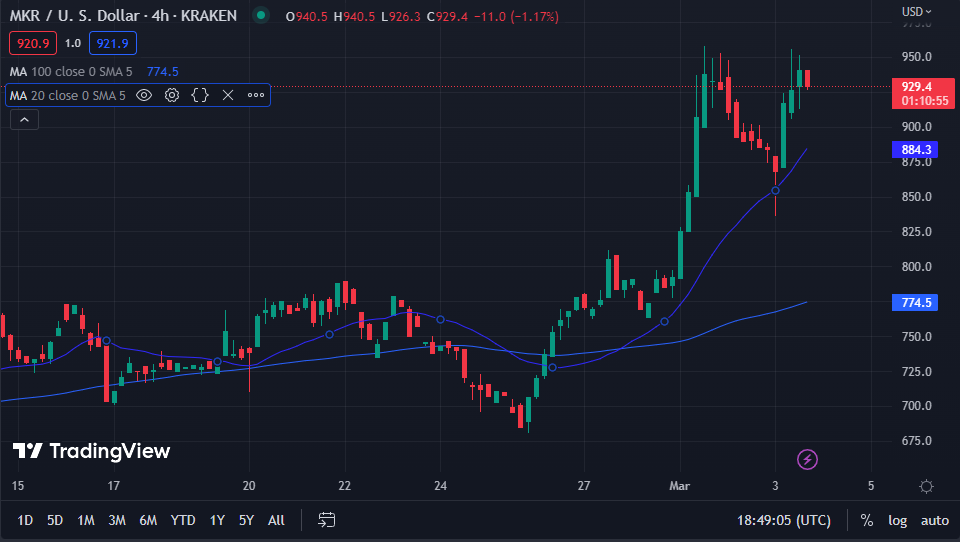
MKR/USD 4-hour price chart (source: TradingView)
MKR’s bullish momentum may continue with a golden cross and MACD indicating buying pressure, but caution is advised as RSI and CMF suggest possible downturns.
At Tokenhell, we help over 5,000 crypto companies amplify their content reach—and you can join them! For inquiries, reach out to us at [email protected]. Please remember, cryptocurrencies are highly volatile assets. Always conduct thorough research before making any investment decisions. Some content on this website, including posts under Crypto Cable, Sponsored Articles, and Press Releases, is provided by guest contributors or paid sponsors. The views expressed in these posts do not necessarily represent the opinions of Tokenhell. We are not responsible for the accuracy, quality, or reliability of any third-party content, advertisements, products, or banners featured on this site. For more details, please review our full terms and conditions / disclaimer.