
Bearishness reigned in the Polkadot (DOT) market early in the day until the intra-day low of $5.92 provided support. After setting support, bulls grabbed market control, propelling it to an intraday high of $6.25. The bullish run has effectively increased the price by 2.78% to $6.19 as of press time.
During the upturn, market capitalization increased by 2.34% to $7,159,271,490, indicating increased investor interest; however, 24-hour trading volume decreased by 10.86% to $267,493,718. Despite the lower trading volume, the bulls’ price explosion has proved that investors have faith in the Polkadot market. Furthermore, this solid bullish run by investors has shown that the Polkadot market will have a long-term rise.

DOT/USD 24-hour price chart (source: CoinMarketCap)
As the MACD line climbs above the signal line with a value of -0.01 and moves outside the negative zone, the positive momentum in DOT may expand, signaling a buying opportunity soon. As the MACD line continues to advance away from the signal line, it indicates a strong bullish momentum in DOT. The histogram of the MACD is also growing, bolstering the impression that DOT prices are likely to climb shortly.
The Klinger Oscillator trends above its signal line, with a reading of 1.708K, indicating that the buying pressure in DOT is greater than the selling pressure. Thus, investors should consider taking advantage of this buying opportunity capitalizing on the bullish momentum likely to continue soon.
The stochastic RSI reading of 98.10 indicates that the bullish trend is overbought, and as such, investors should consider taking gains at regular intervals as the uptrend is likely to slow. However, given the strong positive momentum and high readings on indicators such as the Klinger Oscillator and Stochastic RSI, it is plausible to assume that the upswing in DOT prices will likely continue.
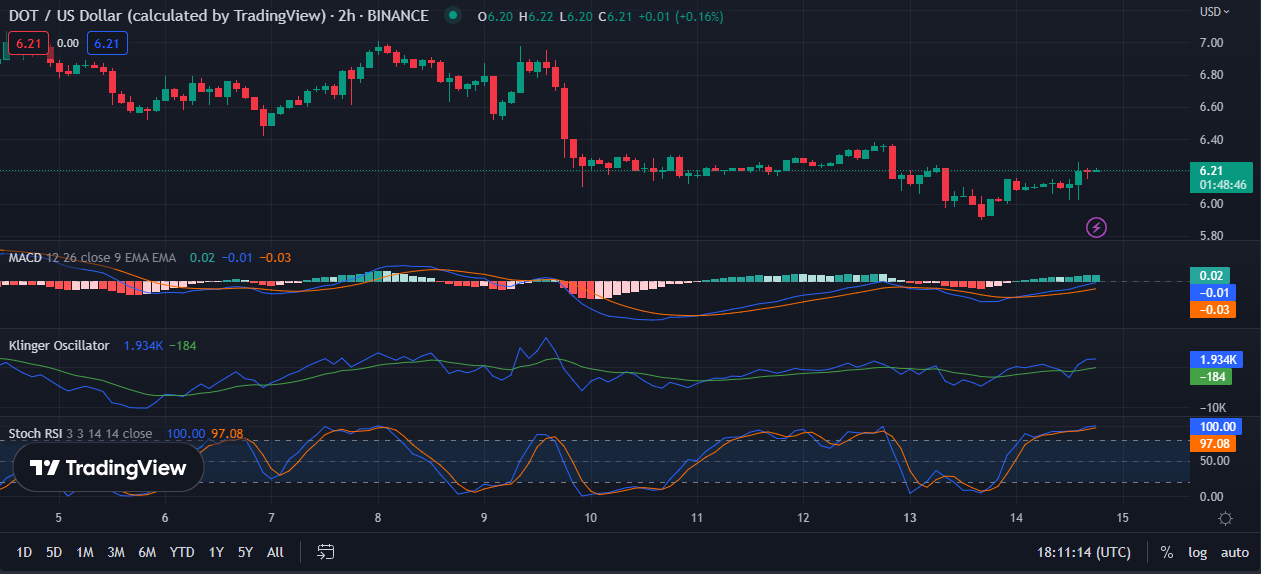
DOT/USD 2-hour price chart (source: TradingView)
The MACD blue line on the 24-hour price chart is trending below the signal line with a value of 0.10 and is going south, suggesting a negative market mood while being positive in the near term. With a value of -0.11, the histogram trends in the negative zone, reinforcing the market’s bearishness. Although the MACD value remains relatively low, the downward trend signals investors may be preparing to execute negative trades to safeguard their holdings.
With a reading of -21.995K, the Klinger Oscillator is drifting below the signal line, indicating a negative market attitude and recommending that investors make bearish swings in the near term. This movement suggests that selling pressure is building and that a sell-off is possible. The trend in the histogram and the Klinger Oscillator shows that negative sentiment is increasing, and investors should make portfolio tweaks to safeguard against potential losses.
The stochastic RSI reading of 2.31 and movement below its signal line also indicate negative sentiment in the market, raising the risk of a sell-off. This trend validates the market’s prediction that selling pressure and negative swings could come soon.
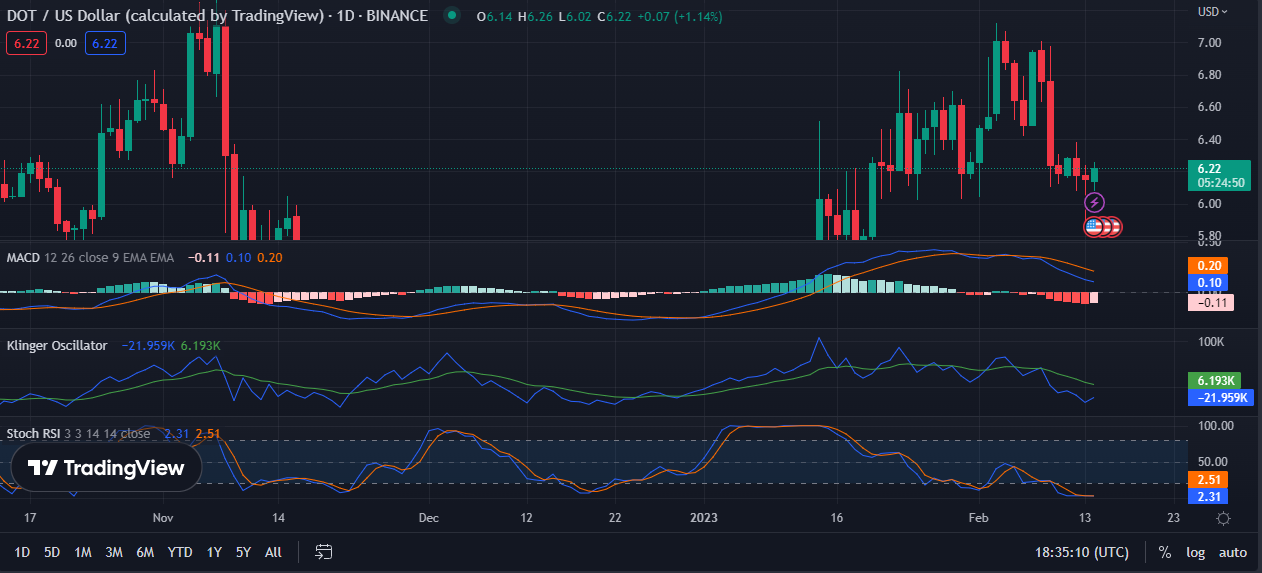
DOT/USD 24-hour price chart (source: TradingView)
While the short-term outlook is favorable, technical indications indicate the upcoming negative trend.
At Tokenhell, we help over 5,000 crypto companies amplify their content reach—and you can join them! For inquiries, reach out to us at [email protected]. Please remember, cryptocurrencies are highly volatile assets. Always conduct thorough research before making any investment decisions. Some content on this website, including posts under Crypto Cable, Sponsored Articles, and Press Releases, is provided by guest contributors or paid sponsors. The views expressed in these posts do not necessarily represent the opinions of Tokenhell. We are not responsible for the accuracy, quality, or reliability of any third-party content, advertisements, products, or banners featured on this site. For more details, please review our full terms and conditions / disclaimer.