
VET/USD Price Analysis
Bearish attempts to grab market share in VeChain’s (VET) market were countered by the established support at $0.02779, making the market persistently bullish over the last 24 hours. At the time of writing, the bullish dominance had pushed the VET price up to $0.02819, an increase of 0.78%, despite meeting resistance at the day’s intraday high of $0.02819.
During the upturn, the market capitalization and 24-hour trading volume increased by 0.80% and 34.97%, respectively, to $2,045,867,777 and $79,041,595. This bullish spike is spurred by hope and conjecture about what the future holds for VET, with speculators predicting that the current surge is merely the beginning of a far larger bull run.

VET/USD 24-hour price chart (source: CoinMarketCap)
The VET USD price chart’s Relative Strength Index (RSI) reading of 48.97 indicates that the market is neither oversold or overbought but instead in a neutral range. However, its decline suggests the possibility of a shift toward bearish market sentiment, implying that investors are more likely to take a wait-and-see approach in the short term.
If the RSI falls below its signal line in the near term, it could indicate that bearish sentiment is gaining traction and that investors should sell their holdings before the market falls too far.
The bullish trend in VET USD appears to be fading, as the Bull Bear Power (BBP) reading of 0.00069747 is very close to the vital level of zero, indicating a lack of momentum for the upward trend. This reading suggests that investors may lack confidence in the market to continue buying in the short term. Still, it could also be interpreted as a sign of consolidation because the market has yet to reach an overbought or oversold level.
The CMF reading of 0.07 and the motion south indicate that selling pressure is building, and it may be prudent for investors to take profits if the RSI falls below its signal line. This level could be a sign of a market reversal, and investors should brace themselves for either a return to bullish sentiment or an extended bearish trend.

VET/USD 4-hour price chart (source: TradingView)
XEM/USD Price Analysis
The NEM (XEM) market bulls have managed to keep the price fluctuating between $0.04104 and $0.06406, its new 90-day high, in the last 24 hours. The new 90-day high has increased investor confidence, with the market now trading well above its historical average of $0.04506. At press time, the bullish control had pushed the XEM price up to $0.05853, a 41.61% increase.
As a result of the token reaching a new 90-day high, traders surged in the market, causing a 41.37% and 4289.88% increase in market capitalization and 24-hour trading volume to $526,478,126 and $428,108,340, respectively.
This increase in market capitalization and trading volume indicates that the XEM market has strong bullish momentum, and investors are profiting from the token’s growth. The bullish rally has been fueled by a combination of strong fundamentals and capital inflows into the market.
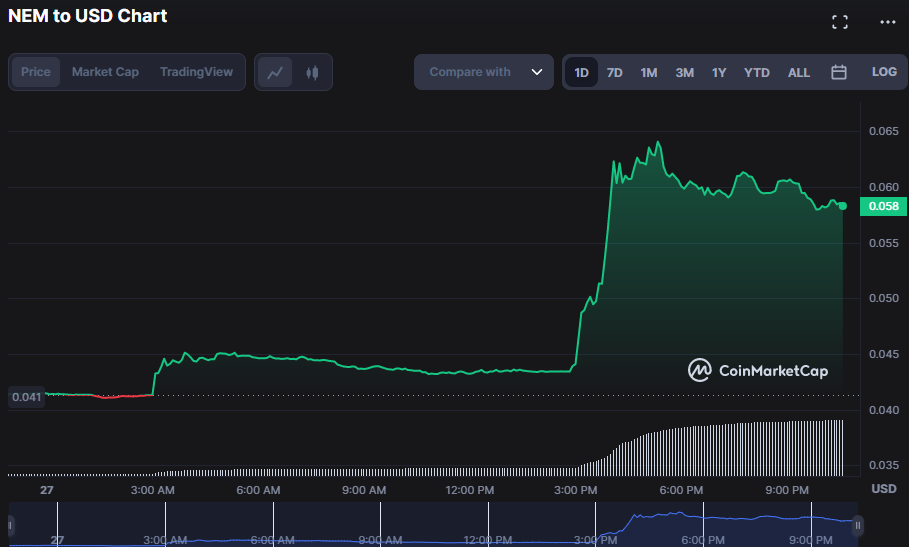
NEM/USD 24-hour price chart (source: TradingView)
With an RSI of 81.73, the NEM market is overbought, indicating that investors may be overly optimistic about future performance. This action warns investors that the market may be unable to maintain its current momentum and may be vulnerable to a downturn if the levels remain so high.
The Bull Bear Power reading of 0.016771329 and the movement north indicate a strong buying trend in the market. However, investors should be wary of the high RSI levels, which could indicate market overvaluation and the possibility of a correction.
Since the Chaikin Money Flow (CMF) value of 0.11 indicates a healthy flow of money into the NEM market, investors may be more confident in this sector than others, and the market is reacting accordingly. Therefore, this level could imply that investors are optimistic about the token and that more money flows into the market.
This inflow of funds, combined with the high RSI levels, may cause concern because it indicates that the market is becoming saturated with buyers and is overvalued. Therefore, investors should be aware of the possibility of a correction soon.

NEM/USD 4-hour price chart (source: TradingView)
VET and XEM show mixed signals, with VET potentially facing a bearish shift, while XEM’s bullish momentum could lead to a correction. Investors should be cautious and keep an eye on key indicators.
At Tokenhell, we help over 5,000 crypto companies amplify their content reach—and you can join them! For inquiries, reach out to us at [email protected]. Please remember, cryptocurrencies are highly volatile assets. Always conduct thorough research before making any investment decisions. Some content on this website, including posts under Crypto Cable, Sponsored Articles, and Press Releases, is provided by guest contributors or paid sponsors. The views expressed in these posts do not necessarily represent the opinions of Tokenhell. We are not responsible for the accuracy, quality, or reliability of any third-party content, advertisements, products, or banners featured on this site. For more details, please review our full terms and conditions / disclaimer.