Bitcoin About To Break Out From Its Brief Symmetrical Triangle

Since bitcoin bottomed out to a new low last month, it has been rallying within a symmetrical triangle. However, a bullish engulfing candlestick can make it break out from this triangle.
BTC Trying To Break
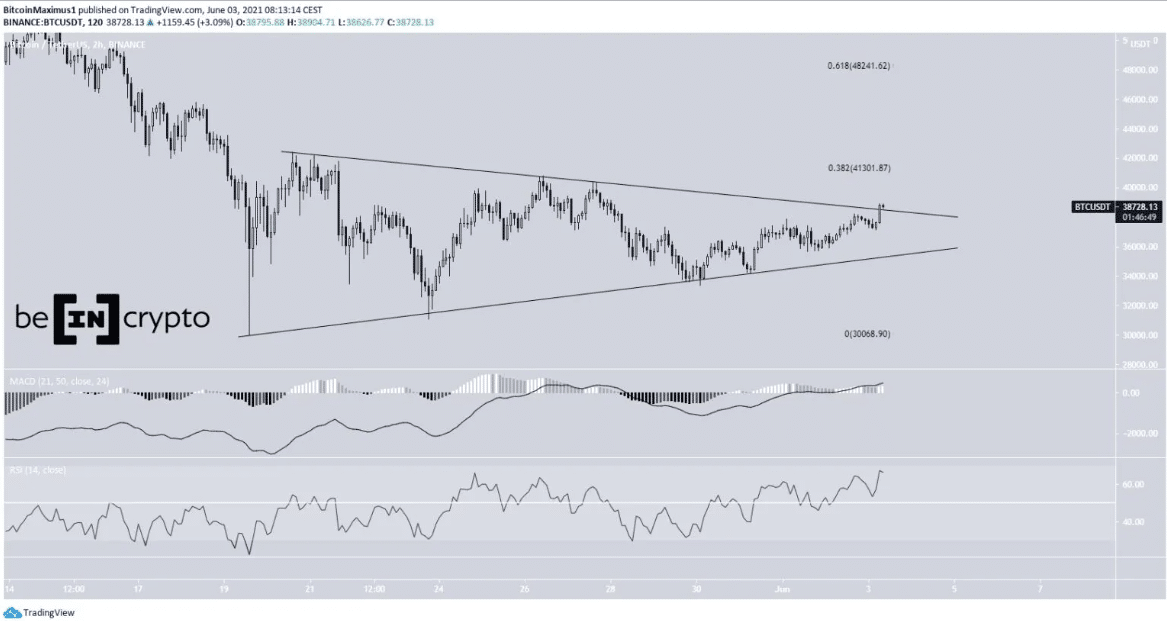
Today’s Asian session sees the leading cryptocurrency rise against the dollar. Since attaining a new low 15 days ago, bitcoin has been hovering around a symmetrical triangle. But it’s about to break out from that triangle now. If it breaks out successfully, its next resistance levels would probably be between $41,400 and $48,300. These predicted resistance levels correspond to 0.383 and 0.619 on the Fibonacci retracement resistance levels. In addition, the MACD and the RSI are on an uptrend which lends credence to the bitcoin upward movement. The rsi is above 50, while the MACD is beneath zero.

BTC symmetrical triangle. Source: Beincrypto and TradingView
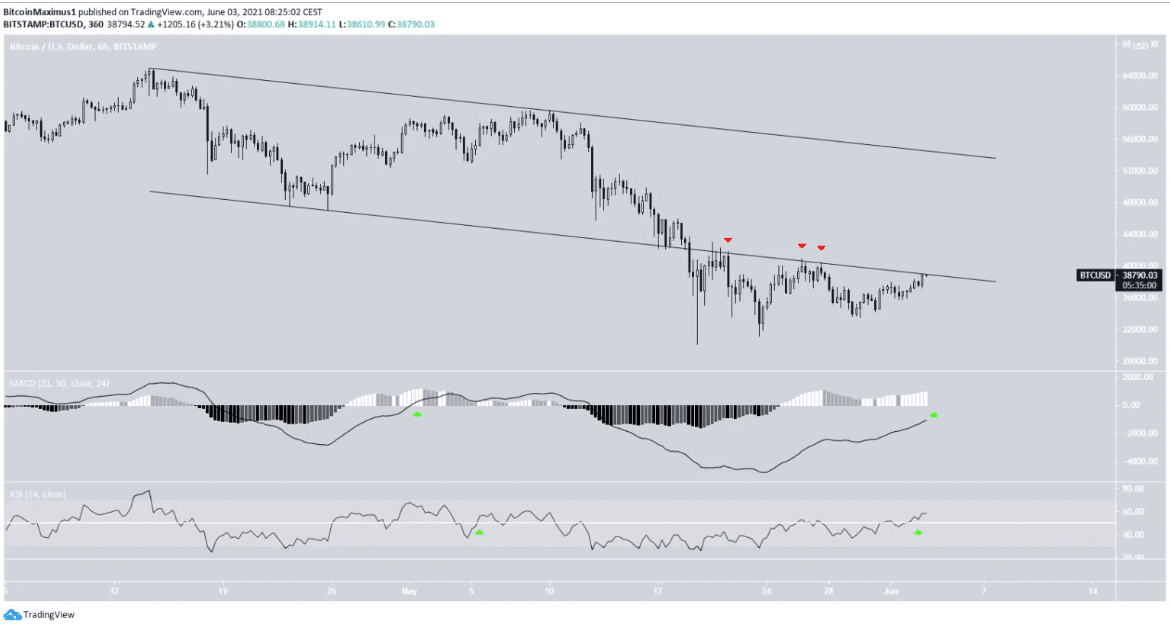
The 6-hour chart also supports the above analysis. The MACD is about to rise above the zero levels on this chart. Also, the RSI has risen above 50 – the first time it has done so since last month. More significantly, bitcoin might soon re-attain the support line of a downward parallel channel. Before now, the support line rejected the price severally (indicated in red in the image below), which was proof that it is a resistance level. Thus, a massive bullish growth would be for it to reclaim that channel.

Bitcoin reclaiming channel. Source: TradingView
Future Outlook
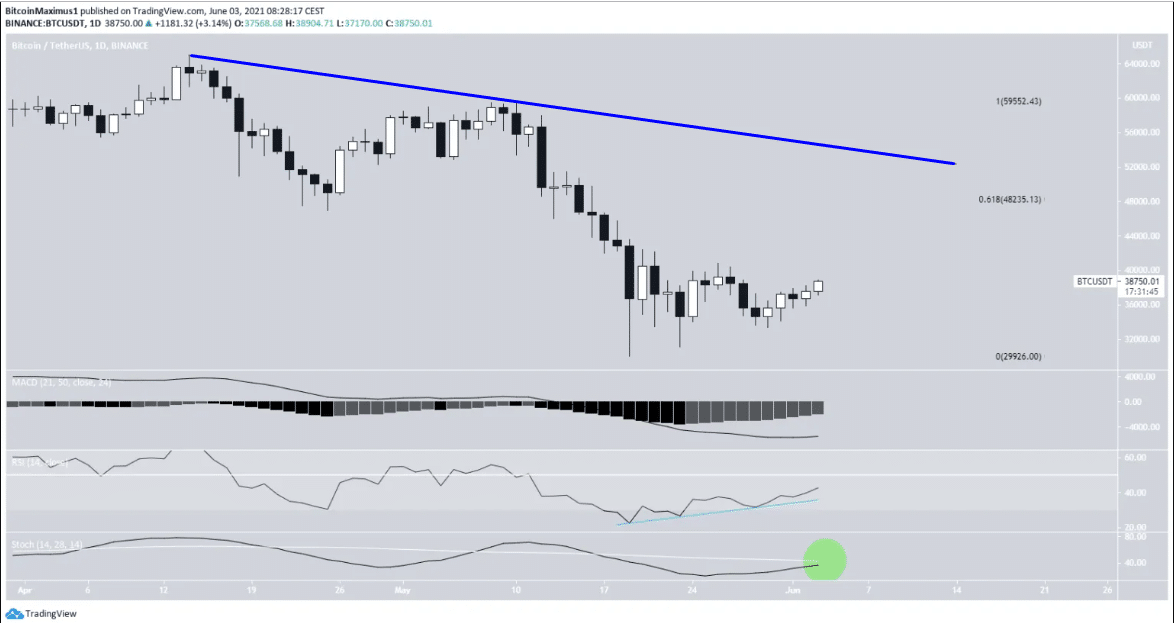
With technical indicators on the verge of being bullish, BTC’s long-term daily chart proves that the analyses above are correct. This is clearly shown on an imminent bullish cross of the stochastic oscillator (the green part in the image below). Also, the rsi has created a distinct bullish divergence and a rising trend line (the blue part in the image below). The best proof of the possible breakout is that the MACD is about to become positive. Lastly, bitcoin is trending on a downward resistance line, almost at the earlier determined $48,300 resistance region. This resistance area is important as it is proof that the BTC will maintain its bullish trend.

BTC chart. Source: TradingView
If the bullish trend continues, its first target will be the $46,00 price range, and once it breaks that, its next target will be the $52,000 range. Conversely, if the bitcoin price fails to rise above the $42,000 range, it could become bearish and continue on a decline to the $32,000 range. The bias might still be bearish unless the price shoots above the 20 exponential moving average (EMA) dynamic level. Determining an exact momentum for the next few days would require an impulsive daily close.
The truth is no market experiences permanent parabolic moves. This period of consolidation is even healthy for the market after some unexplainable uptrends before last month. Those who won’t be disappointed are those who put themselves in the expectation that lots of volatility will still happen in the crypto market over the coming weeks, months, and even years.
Tokenhell produces content exposure for over 5,000 crypto companies and you can be one of them too! Contact at info@tokenhell.com if you have any questions. Cryptocurrencies are highly volatile, conduct your own research before making any investment decisions. Some of the posts on this website are guest posts or paid posts that are not written by Tokenhell authors (namely Crypto Cable , Sponsored Articles and Press Release content) and the views expressed in these types of posts do not reflect the views of this website. Tokenhell is not responsible for the content, accuracy, quality, advertising, products or any other content or banners (ad space) posted on the site. Read full terms and conditions / disclaimer.


