
The Polkadot (DOT) market had a 24-hour bear market after facing severe resistance at the day’s high of $7.34. After the reversal, the price of DOT fell to a session low of $7.03, where support was established.
This dip might be attributed to profit-taking by investors, as some traders benefitted from the upward market trend that saw DOT hit an intra-day high of $7.34. But, at press time, the bears had knocked the DOT price down to $7.07, a 3.28% drop.
Market capitalization fell 3.80% to $8,198,653,425 and 24-hour trading volume 17.73% to $323,024,657 during the recession. This decline in investor confidence and market activity suggests that the prior strong market was a blip or overreaction. To avoid losses, investors liquidated their DOT holdings.
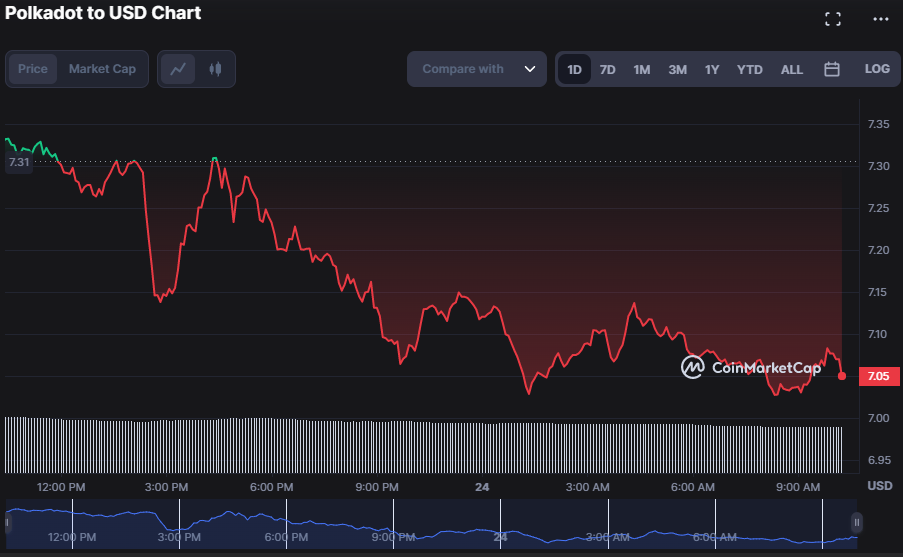
DOT/USD 24-hour price chart (source: CoinMarketCap)
The Chaikin Money Flow (CMF) indicator, on the other hand, shows -0.06, indicating that the DOT market is receiving more negative capital than positive capital. Despite the fact that the Aroon up reading is greater than the Aroon down reading, this reading indicates that bearish capital continues to exceed bullish means.
In the 4-hour price chart, the Aroon up reading of 50.00% trends above the Aroon down reading of 28.57%, indicating that the DOT’s unfavorable market is slowing and that an uptrend is expected. As a consequence, with the Aroon up reading approaching the Aroon down reading and gaining speed, optimistic investors may be able to benefit from DOT’s anticipated surge.
This move may imply that the predicted rebound may take longer than expected, and that pessimistic investors may have a window of opportunity to benefit before the market turns positive.
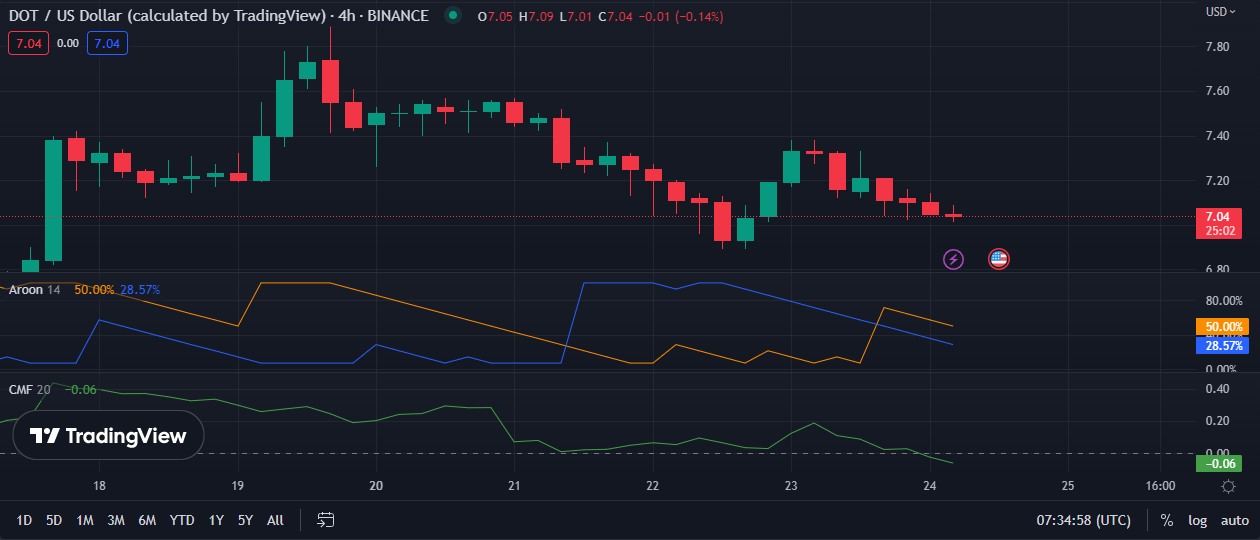
DOT/USD 4-hour price chart (source: TradingView)
The Aroon up continues to perform better than the Aroon down in the 24-hour price chart, with a reading of 64.29% compared to the latter’s 21.43% performance. This change suggests that the Aroon up line is still moving substantially faster than the signal line, which indicates that buyers control the market and prices may continue increasing, despite the fact that the near-term outlook is negative.
With a value of 0.07, the CMF also trends above the “0” line, which indicates that, despite the currently unfavorable market conditions, there is still a significant amount of net money flow into the DOT market. Even if the DOT market faces some short-term downward pressure, it is likely that a positive mood will prevail over the long run if prices remain at this level.

DOT/USD 24-hour price chart (source: TradingView)
While the DOT market is now bearish in the short term, there is a possibility that it may ultimately come back as indications indicate increasing bullish strength.
At Tokenhell, we help over 5,000 crypto companies amplify their content reach—and you can join them! For inquiries, reach out to us at info@tokenhell.com. Please remember, cryptocurrencies are highly volatile assets. Always conduct thorough research before making any investment decisions. Some content on this website, including posts under Crypto Cable, Sponsored Articles, and Press Releases, is provided by guest contributors or paid sponsors. The views expressed in these posts do not necessarily represent the opinions of Tokenhell. We are not responsible for the accuracy, quality, or reliability of any third-party content, advertisements, products, or banners featured on this site. For more details, please review our full terms and conditions / disclaimer.