
After a weak positive trend that gave way to negative efforts to take Ethereum’s (ETH) market, the price fell to an intraday low of $1,577.12. In the following 24 hours, however, bulls rebounded and propelled the ETH price to a new 90-day high of $1,732.80. As of press time, the bulls had effectively increased the price by 8.35% to $1,712.43.
Both market capitalization and the 24-hour trading volume increased by 8.86% to $210,294,227,410 and 71.91% to $13,263,623,901, showing a general uptick in mood and investor confidence. BTC seems to have set the pace for the upward trend, increasing by 9.53% to $25,134.12, while ETH’s high price rise contributed to a stronger argument for its growing market power.
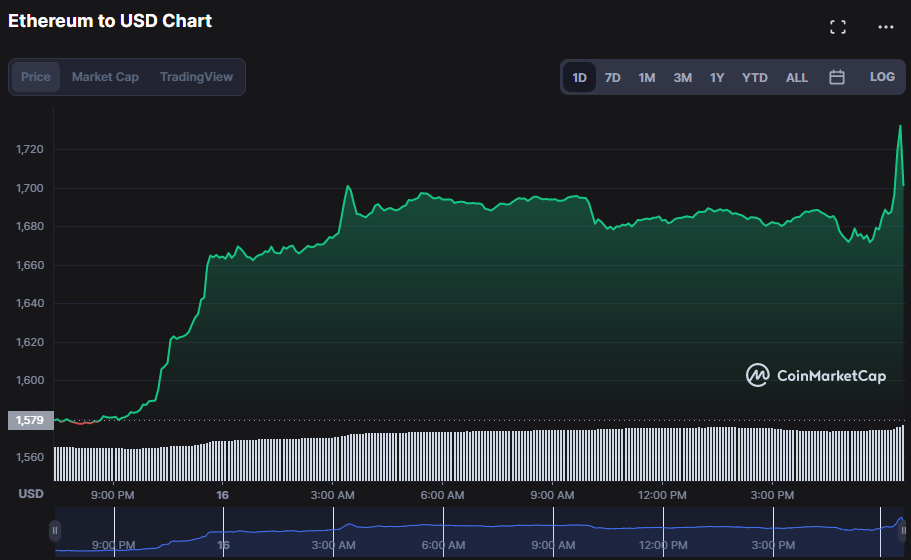
ETH/USD 24-hour price chart (source: CoinMarketCap)
The rising Kelter Channel bands on the 2-hour price chart, with the top bar at 1701.44 and the lower band at 1594.83, depict a volatile market and show prices will fluctuate between these limits shortly. The positive trend in the ETH market is continuing as the price oscillates above the upper band. However, if the price falls below the lower band, it may imply a negative trend and downward pressure on the market.
With a value of 34.87, the stochastic RSI is drifting below its signal line, indicating that a bearish crossover may be on the horizon and the ETH market may be going lower. If the negative trend is confirmed and the price of ETH breaks below the lower range, it might imply that a further slump is coming, and investors should be aware of possible losses. If the bulls continue, and the stock RSI moves above the signal line with a value greater than 50, this may imply that the ETH market is developing bullish momentum and that buyers are gaining strength.
The Rate of Change (ROC) trending south with a reading of 2.27 indicates that the price of ETH is decreasing, as the ROC measures how much prices change over a given period. In other words, the decreasing ROC combined with the bearish trend may indicate that ETH prices are in a downward spiral, so investors should be cautious.

ETH/USD 4-hour price chart (source: TradingView)
The Keltner bands on the 24-hour price chart touch at $1737.29 and $1445.49, respectively, showing the bullish trend in ETH. The critical gap between the two Keltner bands indicates a rise in ETH price, indicating an overall upswing in the crypto market. A buy signal forms when the price action produces a green candlestick and climbs toward the upper band as the bullish momentum expands. This buy signal strengthens when the price breaks out of the upper Keltner band, confirming a bullish continuation and an excellent chance to begin an extended position.
As the stochastic RSI trends north with a reading of 66.21, indicating that the asset is likely to continue in an uptrend, traders may consider placing a long position with a tight stop-loss in place to safeguard their capital. As the rally continues, the price may finally break through the upper Keltner zone, testing higher highs before reaching exhaustion. In order to prevent possible losses if the price reverses direction, stop-loss should be positioned just below the previous high.
The ROC reading of 2.48 also indicates that the present uptrend is likely to continue; however, reversals may be imminent if the price fails to achieve a new high and falls below the Keltner band. While technical indications show that a long position is now an appealing alternative, it is critical to be cautious and mindful of possible price reversals.
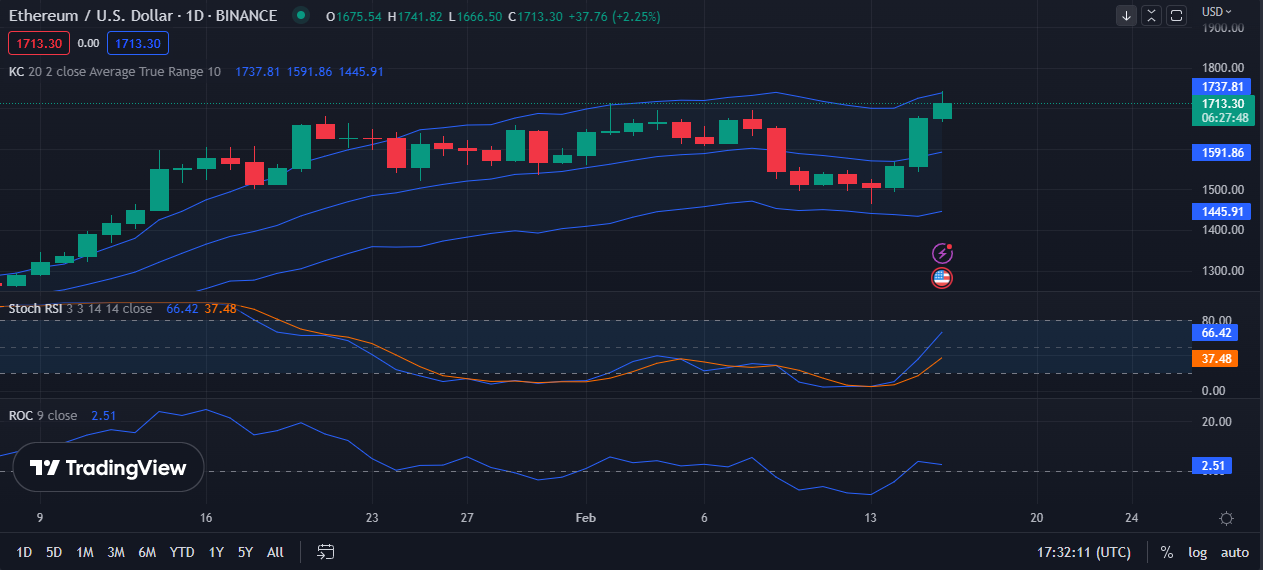
ETH/USD 24-hour price chart (source: TradingView)
Bulls must drive prices higher and sustain resistance if the positive sentiment in the ETH market is to continue in the short run.
At Tokenhell, we help over 5,000 crypto companies amplify their content reach—and you can join them! For inquiries, reach out to us at [email protected]. Please remember, cryptocurrencies are highly volatile assets. Always conduct thorough research before making any investment decisions. Some content on this website, including posts under Crypto Cable, Sponsored Articles, and Press Releases, is provided by guest contributors or paid sponsors. The views expressed in these posts do not necessarily represent the opinions of Tokenhell. We are not responsible for the accuracy, quality, or reliability of any third-party content, advertisements, products, or banners featured on this site. For more details, please review our full terms and conditions / disclaimer.