In the past 24 hours, the Shiba Inu (SHIB) market has been bullish, with the price bouncing between support and resistance levels of $0.00001261 and $0.00001363. At press time, this bullishness remained due to new investors’ inflow and increased demand for SHIB, resulting in a 3.45% increase to $0.00001307.
With increased bullishness, the Shiba Inu market looks to relive a new bull run, triggering a 3.45% and 46.11% increase in market capitalization and 24-hour trading volume, respectively, to $7,174,342,133 and $423,142,971. Analysts predict that the market capitalization and 24-hour trading volume of SHIB will continue to rise in the coming days as investors gain confidence in Shiba Inu’s prospects.

SHIB/USD 24-hour price chart (source: CoinMarketCap)
In the SHIB price chart, the Bollinger bands move south, with the upper band touching 0.00001352 and the lower band touching 0.00001225, implying that bears are still present in the market despite being bullish. This is a sign of a robust market since it implies that the bulls, who have driven the price up to this point, are still taking profits.
Yet, the market remains optimistic, as indicated by the upper band continuing above 0.00001300 and exhibiting no indications of a drop. If the upper band falls below this level, it indicates that pessimistic sentiment has taken over the market and might lead to a downward trend in pricing.
When the stochastic RSI goes below its signal line and heads south with a reading of 62.21, the present optimistic emotion may be fleeting, as the market may have already achieved its high and is on the brink of moving to negative momentum.
If the market does turn negative, it may create an opportunity for profit-taking for those who purchased at lower levels, as prices are expected to fall back below the 0.00001300 upper range, allowing them to capitalize on their holdings.
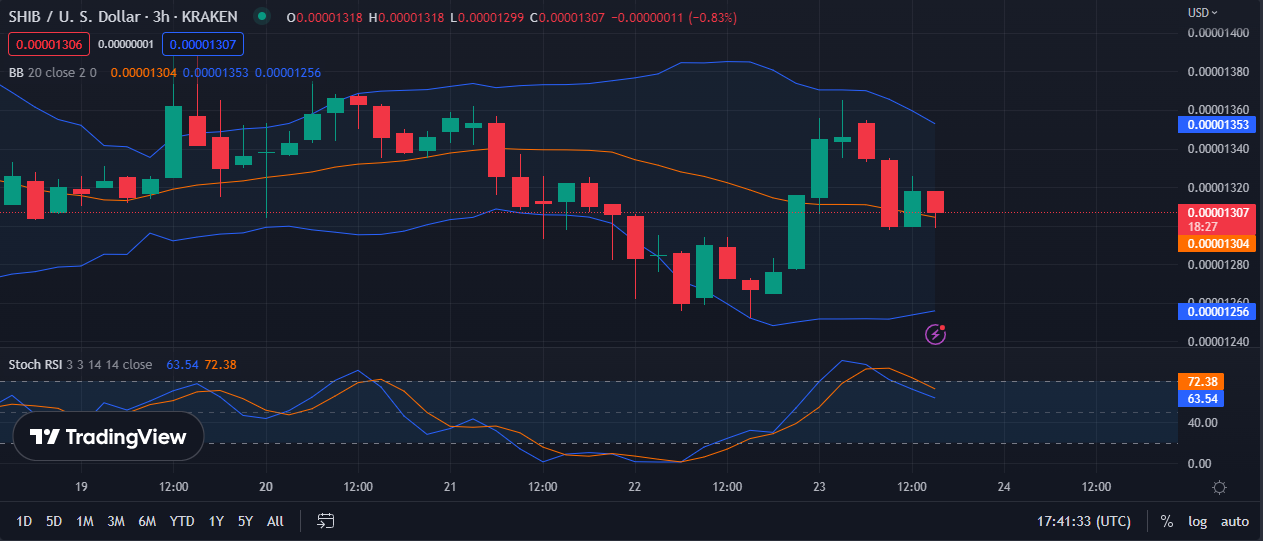
SHIB/USD 3-hour price chart (source: TradingView)
CFX/USD Price Analysis
Despite the bear’s efforts to capture market share after the price sank to an intraday low of $0.268 in the previous 24 hours, the Conflux (CFX) market has experienced a bullish mood in the last 24 hours. Bearish momentum, meanwhile, was short-lived, as bulls pushed the price to an intra-day high of $0.3196. By press time, the bullish supremacy had moved the price to $0.2835, a 3.68% increase.
Market capitalization and 24-hour trading volume increased by 3.67% and 5.35%, respectively, to $592,762,978 and $375,154,487. This increase in trading activity and market capitalization implies that, despite negative efforts to take market share, bulls have regained their momentum and re-established market confidence.

CFX/USD 24-hour price chart (source: CoinMarketCap)
The bullish trend in CFX may diminish and be susceptible to a bearish reversal since the Aroon up reads 7.14% and moves below the Aroon down, which reads 42.86%. Nevertheless, the fact that the Aroon up is still positive might indicate that a bearish reversal is not imminent and that the bullish trend can continue, although at a reduced level.
This motion indicates that buying pressure is present, and investors may be able to benefit, albeit they must stay alert in watching CFX’s indications since a negative reversal may still occur.
Although the Bull Bear Power (BBP) trended in the negative zone with a value of -0.01522274, this bullish trend may not be as powerful as first assumed. The current reading indicates that the bearish reversal is gaining traction, and if the BBP continues in its negative trend, the bullish trend may terminate shortly.
As a result, investors should monitor the Aroon up and BBP indicators to avoid missing any negative warnings, as the weak bullish trend may be temporary, and a bearish reversal may quickly take its place.
With a reading of 49.74, the RSI is trending below its signal line, indicating a probable bearish reversal. This negative trend implies that investors should proceed warily when making their following trading choices since the recent negative regression may quickly lead the positive movement to fade.

CFX/USD 3-hour price chart (source: TradingView)
Bulls must drive SHIB and CFX prices higher against indicator projections if bullish strength is to persist in the market.
At Tokenhell, we help over 5,000 crypto companies amplify their content reach—and you can join them! For inquiries, reach out to us at info@tokenhell.com. Please remember, cryptocurrencies are highly volatile assets. Always conduct thorough research before making any investment decisions. Some content on this website, including posts under Crypto Cable, Sponsored Articles, and Press Releases, is provided by guest contributors or paid sponsors. The views expressed in these posts do not necessarily represent the opinions of Tokenhell. We are not responsible for the accuracy, quality, or reliability of any third-party content, advertisements, products, or banners featured on this site. For more details, please review our full terms and conditions / disclaimer.