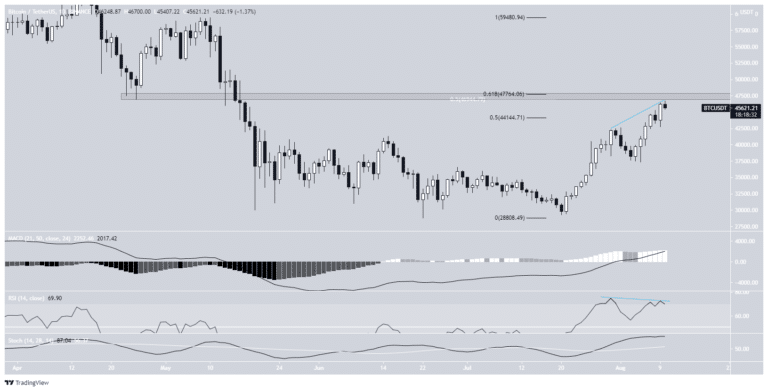
Bitcoin price has boosted immensely during the week of Aug 2-8, as it reached a high of $45,310. Currently, it is moving toward an intense confluence of resistance levels which is between $46,950 and $47,750. In addition, short-term time frames are currently showing shortcomings and weaknesses. Bitcoin (BTC) has developed three successive bullish candlesticks in the weekly time frame and is currently in the process of building a fourth.
Its upward move started after the price bounced at the $29,000 horizontal support area on July 21. And now, Bitcoin (BTC) is trading under the 0.5 Fib retracement resistance level at $46,950. Technical indicators are revealing some bullish signs, but not enough to ascertain a bullish reversal. While the MACD has given a bullish reversal signal and the RSI has just crossed above 50, the Stochastic oscillator is still bearish.
Bitcoin Moves Towards Resistance
Following the daily chart, it shows that Bitcoin (BTC) is gradually approaching a strong resistance level between $46,950 and $47,750. This resistance is created by the short-term 0.618 Fib retracement résistance level (black), the previously outlined long-term 0.5 Fib retracement level (white), and a horizontal resistance area. While technical pointers are still bullish, there is a potential bearish divergence developing in the RSI.

BTC/USDT Crypto Chart – Source: TradingView
Bitcoin Future Movement
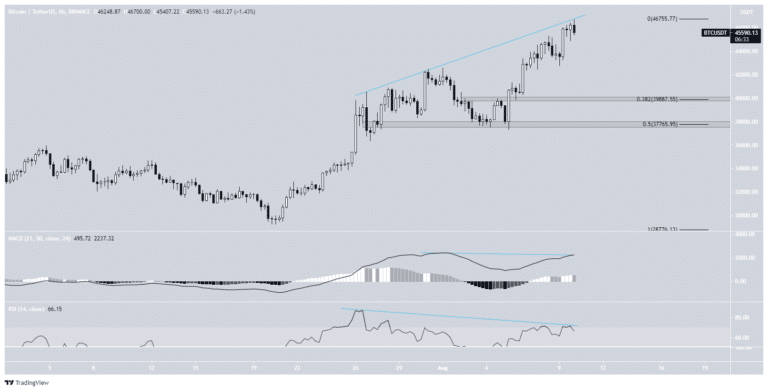
Furthermore, there are more signs of weakness in even shorter time frames such as the six-hour chart. Both the RSI and MACD have created bearish divergences. In addition to this, it seems that BTC is pursuing an ascending resistance line, which has just rejected the price. If a downward move happens, the nearest support levels would be found at $39,900 and $37,750.

BTC/USDT Chart – Source: TradingView
In addition to this, the two-hour chart provides a very similar reading. Both the MACD and RSI have generated considerable bearish divergences. These readings bolster the possibility that a short-term lowered move could soon happen at any time.
At Tokenhell, we help over 5,000 crypto companies amplify their content reach—and you can join them! For inquiries, reach out to us at info@tokenhell.com. Please remember, cryptocurrencies are highly volatile assets. Always conduct thorough research before making any investment decisions. Some content on this website, including posts under Crypto Cable, Sponsored Articles, and Press Releases, is provided by guest contributors or paid sponsors. The views expressed in these posts do not necessarily represent the opinions of Tokenhell. We are not responsible for the accuracy, quality, or reliability of any third-party content, advertisements, products, or banners featured on this site. For more details, please review our full terms and conditions / disclaimer.
