An influx of investments into the crypto market has caused the crypto market to be bullish. Over the past three months, the greed and fear index has been pointing to fear as investors’ trust in the market continues to be eroded. Consequently, the price of most tokens depreciated massively during this period, with the overall evaluation of the market also declining.
The Crypto Market Is Bullish
One other positive for the crypto market is Russia’s announcement that it would create a crypto roadmap and not ban crypto activities completely. The news emanating from Russia affects the crypto market as the Russian crypto space has a huge role in developing Web3.0.
Another cause of bullishness in the crypto market is that credit card giant, Visa, now allows all BTC holders to access crypto-enabled cards. Previously, Visa only allowed large BTC holders access to crypto-enabled credit cards. Hence, it is no surprise that there has been an increase in the total value of crypto-related transactions through Visa.
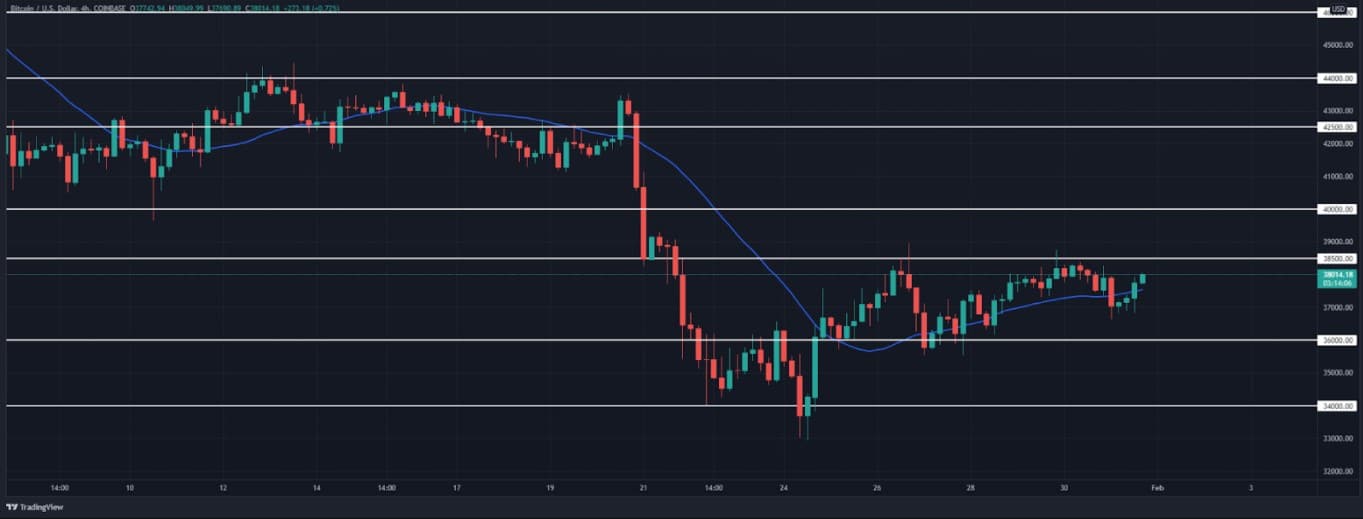
BTC price is bullish today after an uptrend to trade around the $37K mark. Hence, it is likely to surge past its next local resistance of $38.5K before heading towards its next crucial resistance of $40K. Even though the market has been bearish over the past 24 hours, the slight upwards movement is a sign that it might turn bullish soon.
BTC Price Action On The 24-Hour Chart
BTC has been hugely volatile in the past 24 hours as it remains range-bound between the $36.73k and $38.17k levels. The chart further shows that the BTC price struggle around the 20-day, 50-day and 100-day SMA. A close above the 20-day SMA would see BTC price trade around the $40k mark.
Conversely, if the BTC price line should form a Doji candlestick, it would invalidate the bullish hypothesis and might lead to another bearish period, even if it is for a short time. If the BTC price is declining, it will find support around the $32.9K mark. Its total trading volume is now $18.20B following a 23% increase. Also, its market dominance is now about 42% as its market cap moves closer to $719B.
BTC Price Action On The 4-Hour Chart
BTC price movement is bullish on the 4-hour chart, with support found at $37k. BTC price showed signs of bullishness this past week. It started showing an uptrend by establishing a lower low after testing the $33K level. After that, it surged past the $38.5K level before being range-bound around the $36K level four days ago.

BTC price movement 4-hour chart. Source: TradingView
Between January 28 and 31, it retraced back from the $38.5K level and consolidated around the $34-35K range. While the bears were in temporal control of the BTC price on January 30, the bulls re-took control and intensified the buying pressure, which pushed the BTC price towards breaking the $38.5K local resistance.
A sustained buying pressure within the next 48 hours should push the leading cryptocurrency’s price to exceed the $40K barrier. As of this writing, BTC currently trades at $38.68K.
At Tokenhell, we help over 5,000 crypto companies amplify their content reach—and you can join them! For inquiries, reach out to us at info@tokenhell.com. Please remember, cryptocurrencies are highly volatile assets. Always conduct thorough research before making any investment decisions. Some content on this website, including posts under Crypto Cable, Sponsored Articles, and Press Releases, is provided by guest contributors or paid sponsors. The views expressed in these posts do not necessarily represent the opinions of Tokenhell. We are not responsible for the accuracy, quality, or reliability of any third-party content, advertisements, products, or banners featured on this site. For more details, please review our full terms and conditions / disclaimer.
