Below is a closer analysis of the price performance of ETH, SOL, ADA, XRP, and DOT.
ETH Price Movement
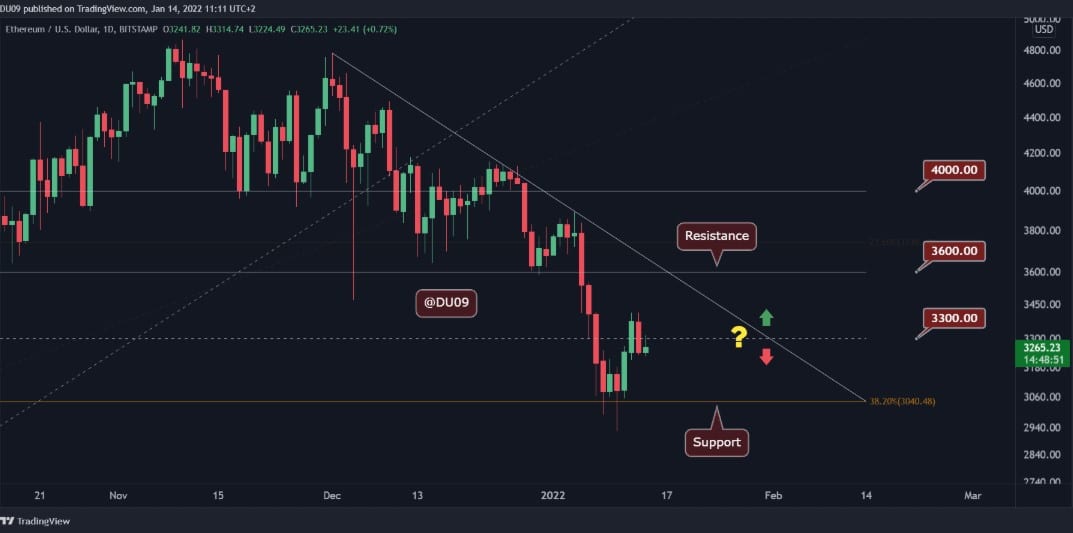
As previously forecasted, ETH’s 3-month decline is now over after the second top crypto found support at the $3K levels this past week. However, it is yet to stabilize around that support as it still dipped 4.7% in the last week. If it is consistent with this bullish run, ETH will likely retest its next crucial resistance of $3.65K.
Currently, its price movement indicates that traders who took an entry position at the critical support are taking profit at about $3.3K – a level that represents ETH market consolidation. While it is still likely that ETH will continue to retest its next crucial resistance, the bulls would need to make considerable effort to ensure that ETH doesn’t reverse towards its recent 3-month downtrend.

ETH 24-hour price chart. Source: TradingView
SOL Price Movement
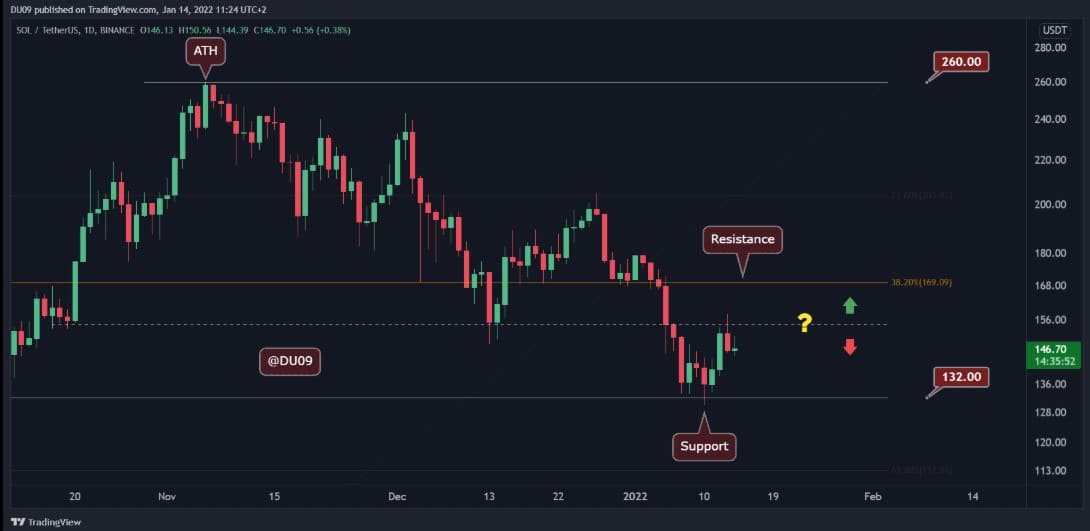
The $135 level acted as the support level to stop SOL’s decline. SOL’s price spiked to the $152 levels as the bulls regained control of this asset. However, SOL’s price fluctuated within this narrow range and even dipped by 3.5% this past week.
SOL’s next crucial resistance would be the $172 level once it can flip its $152 levels into support. Traders have a rising interest in SOL after it flipped the $132 levels into support. Hence, SOL can flip the $152 levels into support soon.
Conversely, if SOL cannot overcome the $152 resistance levels, it would likely stabilize with its current support until the bulls have enough momentum to push it towards breaking out of its current narrow range.

SOL 24-hour price chart. Source: TradingView
ADA Price Movement
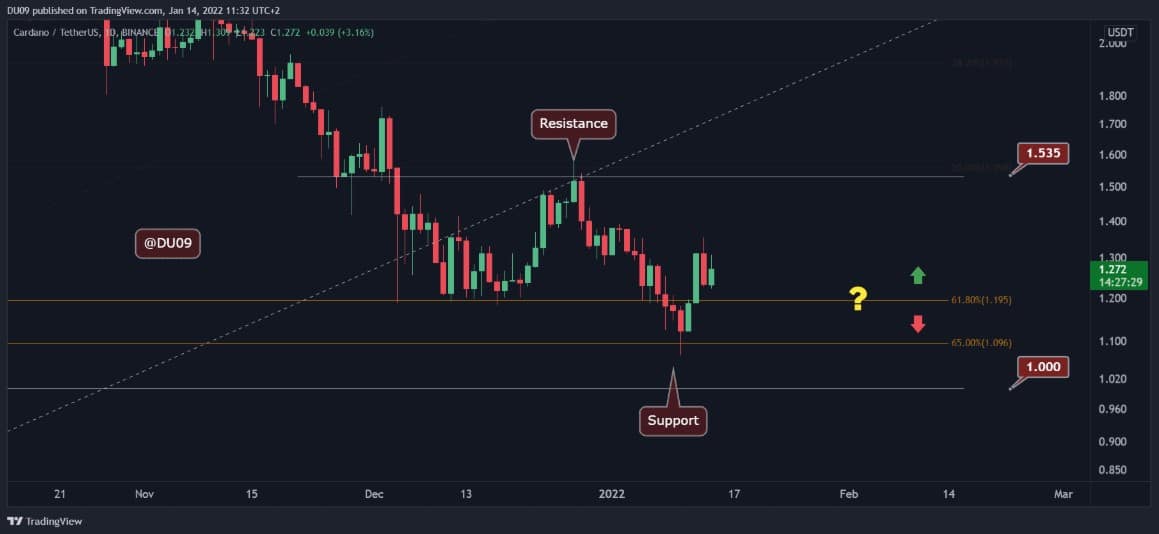
ADA price declined to $1.15 level over the last seven days despite the efforts of the bulls to help it maintain the $1.25 support range. However, it has recovered to the $1.25 range in the last 48 hours and has since maintained that price range.
Despite the bulls’ efforts, the technical indicators (as of this writing) show that ADA is still bearish. ADA’s bearish trend can only be reversed when ADA establishes a high low or a higher high. The $1.55 level is ADA’s next crucial resistance, and that’s only a pipedream based on its current price trend.

ADA 24-hour price chart. Source: TradingView
XRP Price Movement
After finding support at the $0.71 levels, XRP rose to the $0.81 levels, remaining range-bound since then. Like ADA, XRP’s current price was similar to last week. If XRP can breakout of this $0.81 range, its next crucial resistance would be the $0.86 level.
However, the XRP price line crossed over the 1-day MACD, indicating bullishness and hope that XRP can turn bullish over the next few days. But surging over the $0.85 resistance level would be critical before XRP can establish this bullish momentum.
DOT Price Movement
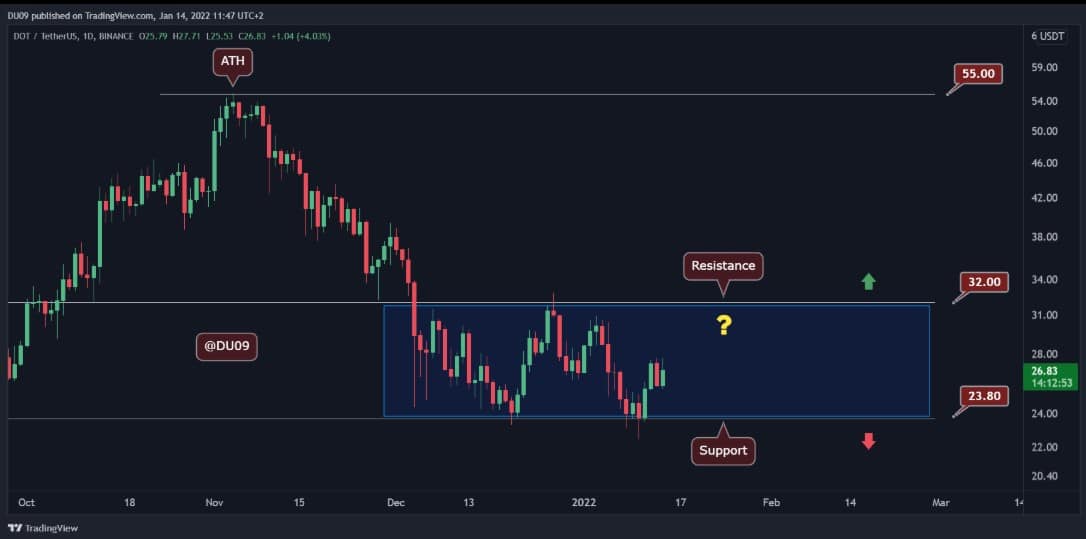
DOT has behaved similarly to ADA and XRP this week, even though it continues to trade between the large range of $23 and $33. The daily MACD and the RSI indicated bullishness, indicating a bullish bias for DOT.
If the bullish theory holds, DOT might likely surge past its next crucial resistance of $33. Until that happens, expect DOT to remain range-bound between $23 and $33.

DOT 24-hour price chart. Source: TradingView
At Tokenhell, we help over 5,000 crypto companies amplify their content reach—and you can join them! For inquiries, reach out to us at info@tokenhell.com. Please remember, cryptocurrencies are highly volatile assets. Always conduct thorough research before making any investment decisions. Some content on this website, including posts under Crypto Cable, Sponsored Articles, and Press Releases, is provided by guest contributors or paid sponsors. The views expressed in these posts do not necessarily represent the opinions of Tokenhell. We are not responsible for the accuracy, quality, or reliability of any third-party content, advertisements, products, or banners featured on this site. For more details, please review our full terms and conditions / disclaimer.
