A trade is profitable only if both the buy and sell orders are placed at the appropriate moment. Traders frequently sell their holdings too soon and lose money, or they continue to trade even if the market flips. Profits dwindle as a result, and the deal frequently ends in a loss.
While it is critical to go with the market, it is equally critical to be aware of indicators of reversal. Traders may avoid purchasing at high and selling at lower prices, which is a normal event for beginning traders, by learning to notice these red indicators. The Relative Strength Index is one indicator that might help traders identify trend reversals.
The Fundamentals Of RSI
The RSI is a momentum indicator that ranges from 0 to 100 and predicts the next change in the value. It’s most commonly utilized to spot oversold and overbought levels in any instrument.
If an asset’s intrinsic price is exceeded in the short term or long term, it is deemed overbought, and this is an initial signal that it could be rectified.
An oversold zone, on the other hand, shows that the item has been oversold and is now trading at a value lower than its inherent value. These assets have been determined to be restoration-ready.
When the RSI is between 50 to 100, it is in the best interest of the bulls. If it is between 0 to 50, on either hand, it indicates that the bears are in control. The RSI level of 50 is considered to be neutral and represents a balance between bulls and bears.
Most chart software considers figures above 70 to be overbought and those below 30 to be oversold by default. Traders who use these figures alone as guidance to buys and sells are likely to be purchasing too soon in the bear market and selling too soon in the bull market.
As a result, understanding how to use overbought and oversold indications to maximize gains is critical. To further understand the fundamentals, let’s look at some examples.
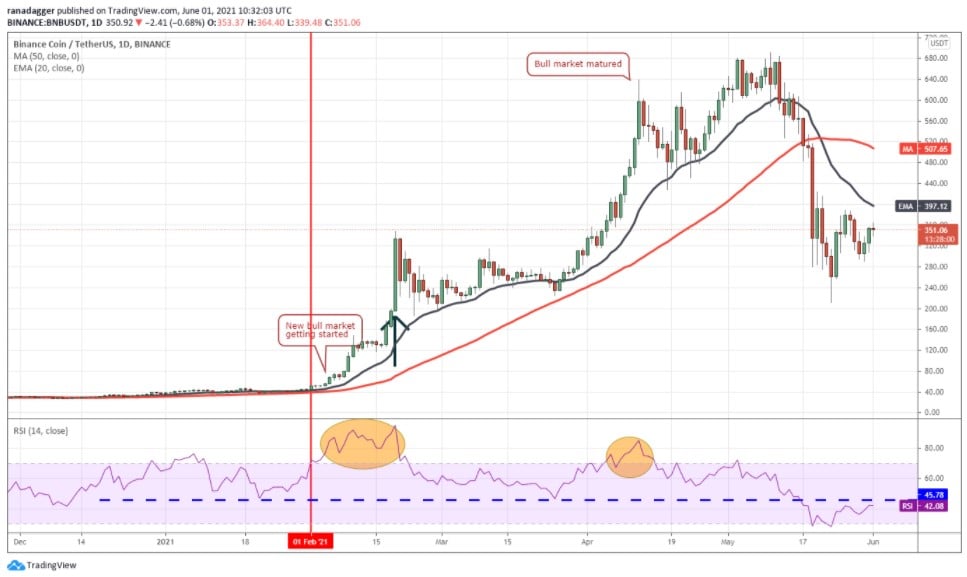
Binance Coin (BNB) surpassed its all-time high and entered the next phase of its climbing trend in February of last year, as shown in the graph above. The RSI has risen above 70, indicating that Altcoin is overbought. Traders who sell now will lose out on a significant share of future profits.
Note that if a coin starts a new uptrend by clearing a zone or major restriction levels, the RSI is likely to remain in an overbought zone. This is because expert traders spot the start of a new upswing and begin purchasing immediately rather than wait for the market to fall. Because continuous buying maintains the Index overbought for a prolonged period, closing the position only because it has moved beyond 70 is not recommended in this scenario.
How To Spot Overbought Terms?
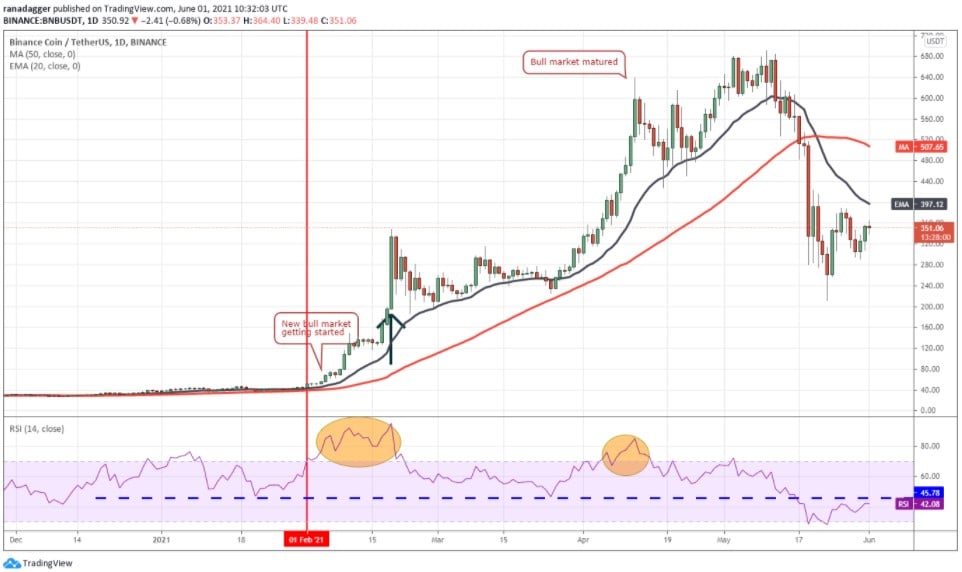
It’s time to be cautious if the RSI goes above 85 at this initial stage. On Feb 19, the RSI for the BNB / USDT pair rose beyond 95 as the market achieved a local high of 348 USD.
The altcoin then dropped 46 percent to $ 186 on Feb 23. Because highs are difficult to anticipate during these frenetic buying times, traders should adjust their stops to safeguard their winnings when the RSI rises above 85.
The RSI surged above 85 on April 12th, reaching a new local high. This shows that traders must be cautious when the RSI reaches 85, even when prices are rising rapidly.
It’s also worth noting that from February to mid-May, the RSI never enters the oversold zone. The RSI normally appears to result in between 40 to 50 during bullish phases. Investors should be careful and look for alternative support indicators to open long positions if the value drops between these levels.
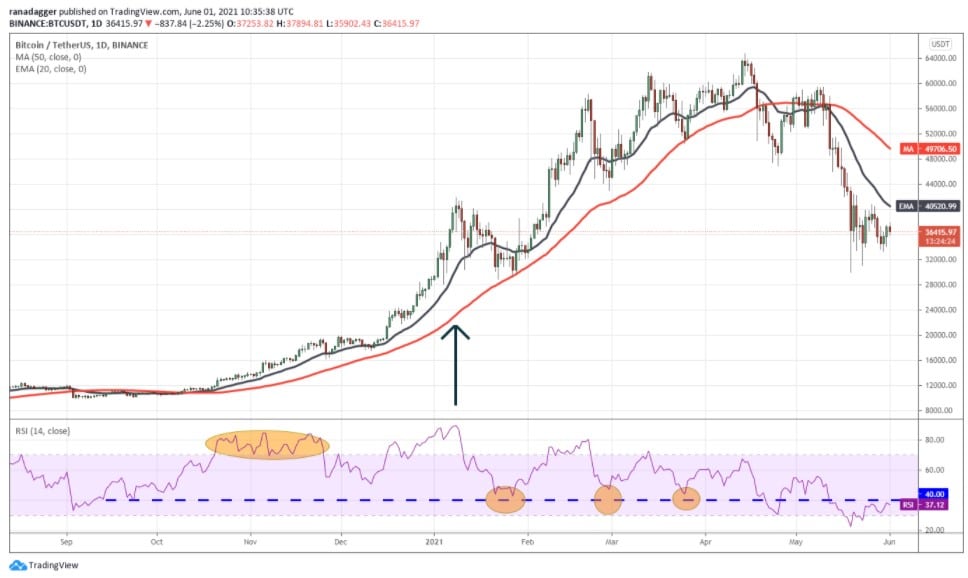
Bitcoin (BTC) began an increasing trend in Oct 2020, as illustrated above. Note how the RSI jumped to 70 and held there for the first several days of the bull phase. During this time, though, the RSI struggled to meet the very overbought zone of 85.
In Jan 2021 the RSI surpassed 85, and investors selling at the time hit the local high. The RSI drops from the overbought range to the 40 levels as the value corrects, providing traders with a buying opportunity.
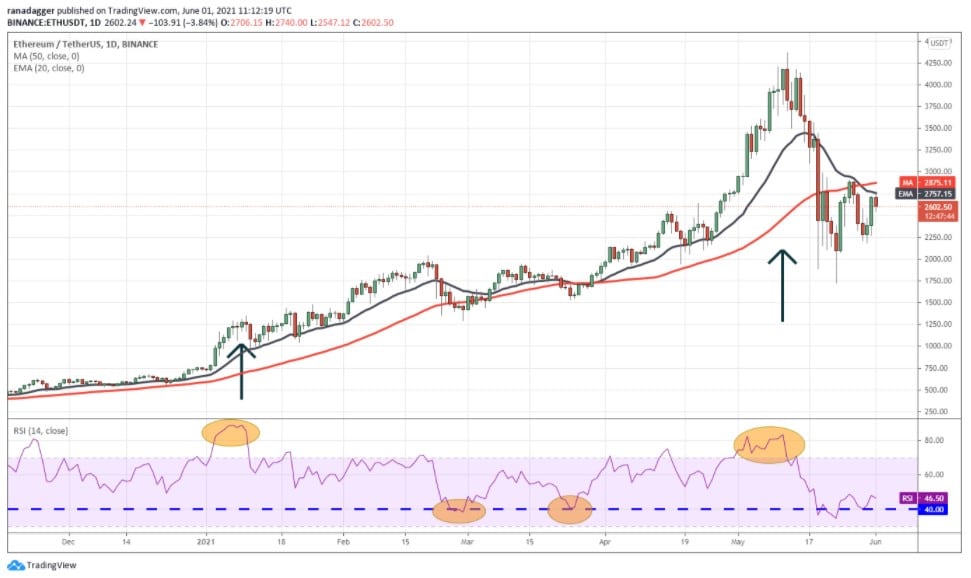
In Nov 2020, Ether (ETH) began a climb, but the RSI struggled to remain in the overbought range. The RSI barely reached 85 in early January, and traders were forced to sell at that point. This demonstrates the fact that no signal or technique is always correct.
When the RSI reaches 40, traders have two additional buying chances. This provides a chance to enter the market and profit from the remainder of the surge.
On May 11, the RSI surged to 83, just below the 85 thresholds, and the biggest altcoin reached its all-time high on May 12.
Negative Divergence
Because the RSI is a movement indicator, when the value rises, so does the RSI. The RSI, on the other hand, does not always match the price activity. Even as pricing climb in instances such as this, the RSI continues to fall.
Negative divergence is the term for this occurrence. This could be an indication that bullish steam is fading.

A negative divergence resulting in a big decline may be seen in the figure above. On January 8, the RSI reached a new all-time high of over 89 as Btc soared to a new all-time high of $ 41,950. The RSI, on the other hand, continued to fall as Bitcoin reached new highs. This is a hint that the bullish trend is losing steam.
Traders should be cautious whenever a negative divergence appears and wait for prices to fall before selling. If the price falls below the 20-day EMA, traders may have to request a sell order. A break under the 50-day SAM line or the 45-day RSI indicates that the trend has shifted.
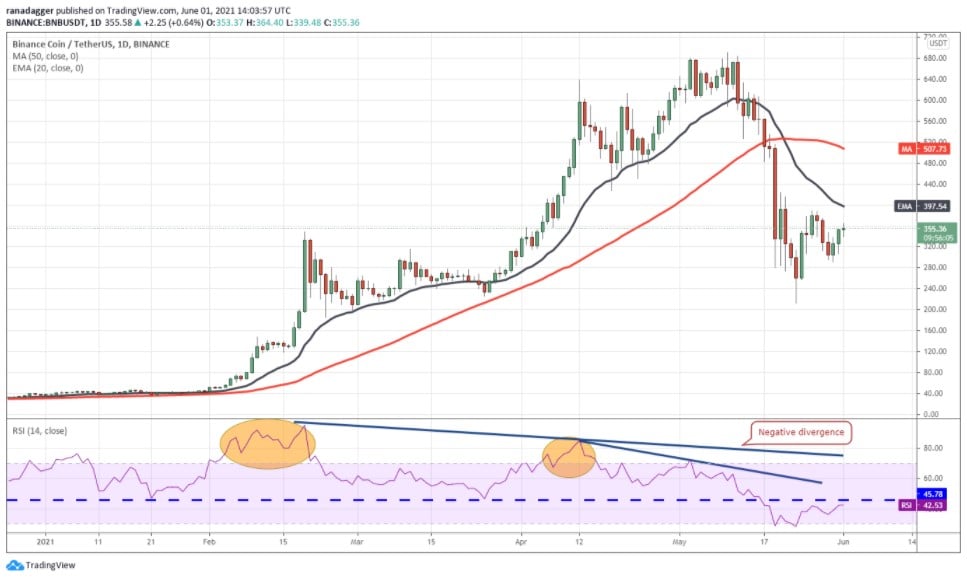
On Feb 19, the RSI surpassed 95 as the BNB reached a new all-time peak of $ 348. The price proceeded to climb after that, but the RSI hit lower highs, forming a bearish divergence. This has alerted traders that the altcoin’s upward momentum is waning and that a trend shift is likely. When the RSI dipped below 45 or the price dropped below the 20-day EMA, investors may have marketed their holdings.
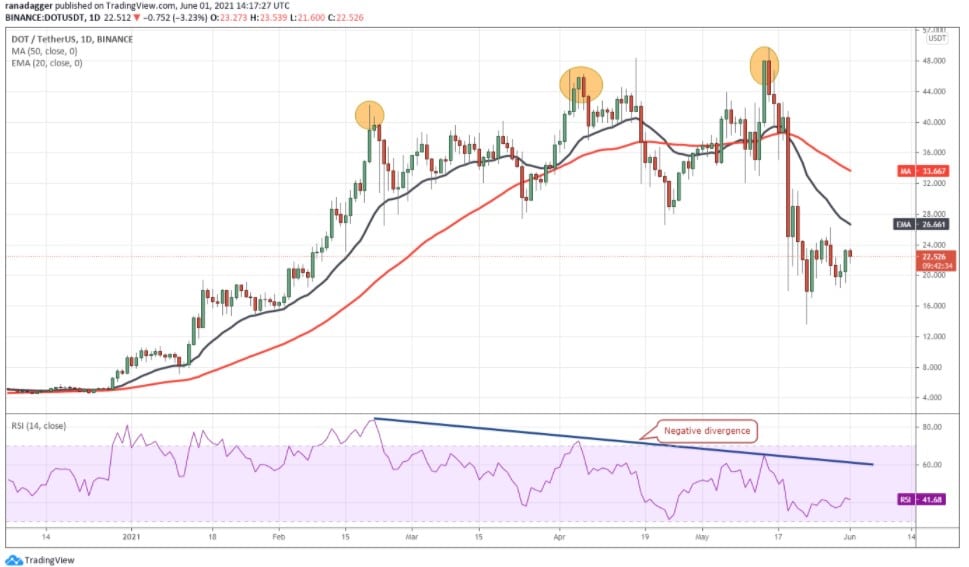
Polkadot (DOT) is also another outstanding illustration of a huge decline caused by negative divergence. The RSI, on the other hand, does not generate a sell indication in this scenario. As a result, we should avoid relying on an index. A break under the moving averages indicates that the market is changing, and investors may have sold since the RSI indicated that momentum was waning.
What Are The Benefits Of Recognizing Deviations?
The RSI is a useful indicator for detecting the completion of an upward trend. Profits can be taken before the trend shifts using both overbought extreme and negative divergence.
Instead of attempting to time the peak, traders should think about selling if the relative strength index and technical indicators indicate that the market is losing traction.
Five Important Roles Of RSI
Aside from identifying overbought and oversold conditions, the relative strength index has certain unique characteristics. These are
- Trendline Application
The fact that the RSI and the final chart practically go together is an important fact. It can be tough to tell which one is the RSI and which is the closing graph at times. Trend lines are drawn in the closing graph, whether it is up or down. In RSI, we can also use the closure line graph in the same way.
It’s worth noting that RSI trend lines are broken at least 3-to 4 days before they are breached, indicating that prices will breach the same linear trend in a day or two.

The chart above shows LIC Housing Finance, and as can be seen, the RSI has already given an early sell indicator.
The first sell indication occurred on May 9, 2017, when the RSI breached the uptrend line, and the 2nd sell signal occurred on June 14, 2017, when the RSI rebounded after breaking the uptrend line and meets strong resistance from the trend line in RSI, as shown in the figure.
The stock corrected nearly 25% from its high shortly after the 2nd sell signal was received.
- Pattern Breakout
We all know that trend development is a fascinating occurrence in chart construction. Any pattern, whether reversal or continuance, will perform a breakout at some point in the future.
It’s interesting to know since RSI examines a stock’s underlying relative strength over a set period of time. Such a breakout in the RSI will take place at least 2-3 days ahead of time, and the price will follow suit.
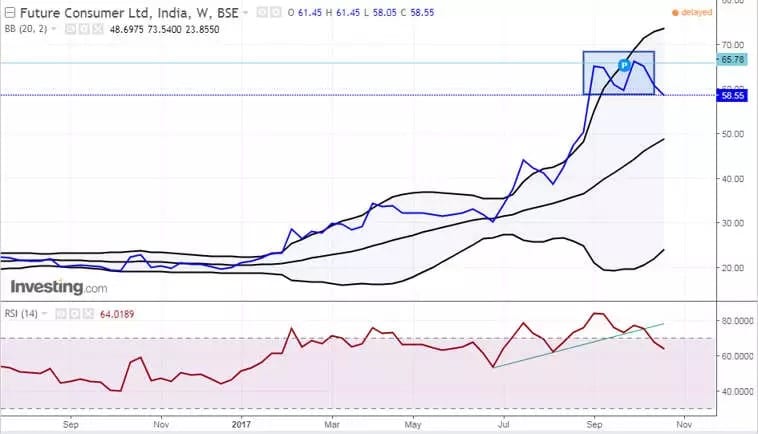
The chart above shows a pattern in the RSI for Future clients. A dual top form at the top and an M-top form in Bollinger bands occurred at the same time, confirming our bullish signal. There was a significant price retreat shortly after the RSI line broke the neckline.
- Advance Breakout And Breakdown
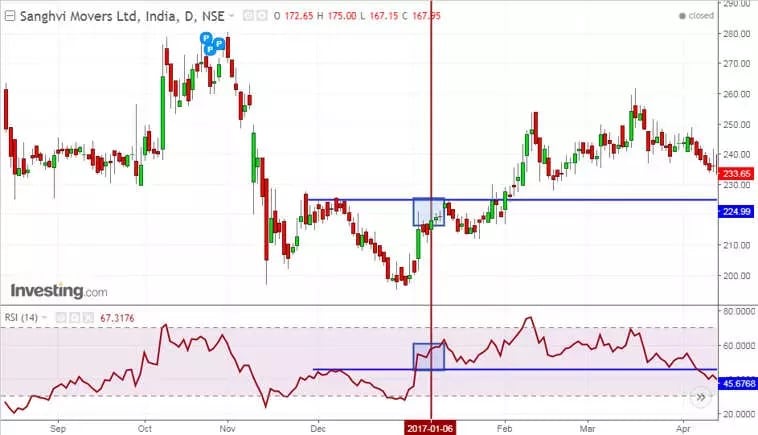
In the OBV indicator, the idea of advance breakout and breakdown performs brilliantly. In the case of RSI, the same principle applies. When the indicator (in this case, the RSI) has surpassed the prior top while the market has not yet surpassed the previous top, it is referred to as an advance breakout.
As a result, it’s essentially an advance or early indicator, implying that the market will track the signal in future sessions. The chart below shows Sanghvi movers. If we look closely at the RSI line, we can notice that the RSI has already surpassed the prior resistance, but the market is still holding below it.
The stock experienced a strong rise shortly following the price breakout.
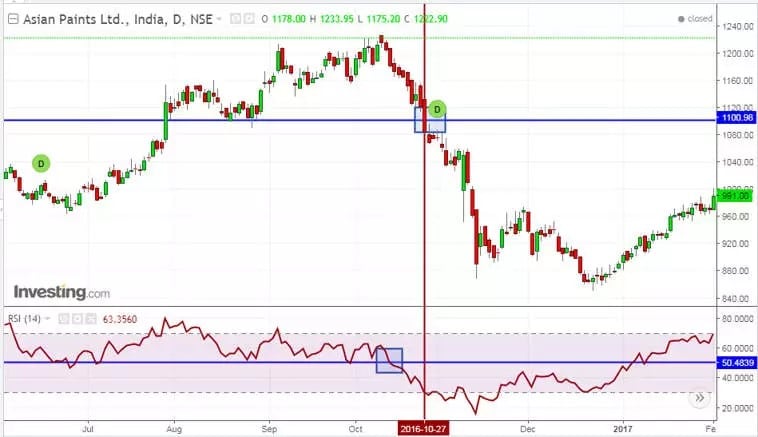
In the case of advanced breakdown, the signal has exceeded the prior bottom but the price remains below or at the prior bottom, indicating that the market may soon breach the former bottom to see some adjustment in the following days.
The value chart of Asian paint below shows that the RSI has already exceeded its previous support. Soon after, the value followed suit and experienced a sharp drop from its previous highs.
- Role Of 50
The mid 50 line in the RSI is a critical line for indicating price movements. During the bullish stage of the marketplace, the value usually stays above the mid 50 lines, while during the negative phase, the price encounters severe resistance from the RSI 50 line.
However, because the daily chart may contain a lot of whipsaws, it’s advisable to look at a larger timeframe chart, such as a weekly chart.
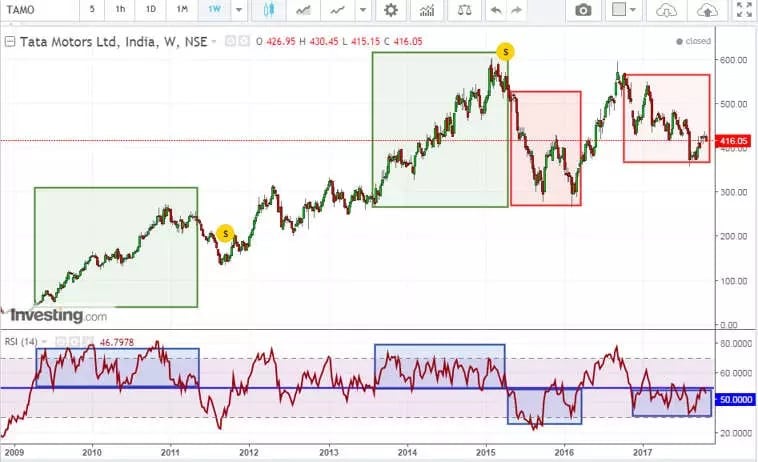
The chart above shows that when the RSI is over the mid 50 lines, the market is bullish, but when it is underneath the mid 50 lines, the stock is showing decent correction.
In a nutshell, we can conclude that the RSI mid 50 line is an excellent trend changer.
- Failure swing
When the RSI falls below 30 (oversold), rebounds above 30, backs away, holds above 30, and then breaks its previous high, it is considered a bullish failure swing. It’s essentially a rise to oversold levels followed by a higher low above them.
The graph below shows Asian Paints, which has a complete and utter failure swing in the RSI. The stock experienced a strong rally shortly after the RSI resistance was broken.
When the RSI climbs over 70, backs away, rebounds manage to exceed 70, and then breaks its preceding low, it is considered a bearish failure swing.
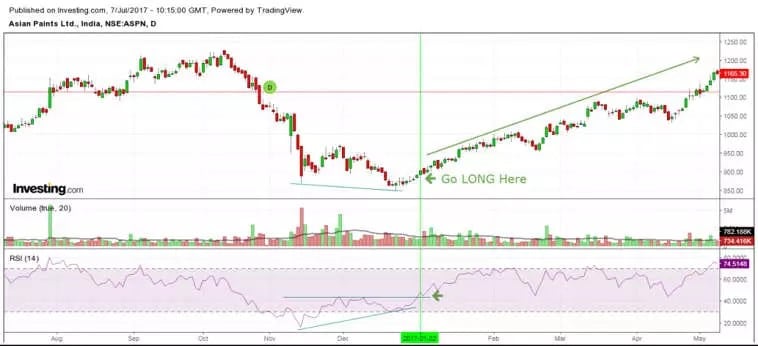
It’s essentially a rise to overbought levels, followed by a lower high below those levels.
RSI Price Action Trade Stop Loss
The stop loss trade should be placed using the fundamental RSI rules mentioned before. Set your stop above the most latest swing on the chart once you’ve identified the critical juncture.
Price Action Forex Trading With RSI
We’re looking at the USD/CAD H4 chart in the figure above. Five trade ideas based on RSI indicators and price activity are shown in the figure.
After the first price drop, the first trade occurs. The RSI crosses into the oversold zone, resulting in a positive divergence. At the same moment, the price movement breaks a Bullish Falling Wedge. So we have 2 bullish RSI indications and a bullish price movement signal. As a result, you could purchase USD/CAD with a stop loss under the bottom formed during the wedge breakout.
Following that, the market enters a consolidation phase, forming the blue triangle on the graph. The triangle creates an exit signal by breaking through the lower level.

The bearish triangle breakthrough, on the other hand, appears to be a misleading indication. The USD/CAD reverses direction and breaks the rising triangle. As a result, you can exploit this occurrence to open your bullish trade by putting a stop loss under the blue triangle’s generated bottom.
When the RSI indicator reaches the overbought zone, a closure signal appears. The RSI line has now entered the overbought zone. After that, it breaks out and the line begins falling. However, the price movement continues to rise, resulting in a bearish divergence. On the graph, an Expanding Triangle forms at the same moment. The triangle has negative potential, and a breakthrough in its bottom level will be used as a shorter entry indicator.
The trade’s stop loss should be set above the Expanding Triangle’s top point. When the RSI indicator hits the oversold zone, the trade should be closed.
We now have a new bullish indication as the RSI reaches the oversold range. A bullish price movement indicator, however, is also required. Luckily, another Expanding Triangle with bullish potential shows on the chart. Also, notice how the triangle’s end hits a support region (black), indicating a possible bottom beneath the blue triangle. This raises the likelihood that the market will begin to move in a bullish direction. As a result, if the price drops the Expanding Triangle upwards, you could initiate a long trade. When the RSI reaches the overbought zone, you may choose to exit the trade.
The RSI line continues to bounce in or out of the overbought zone. Meanwhile, the price movement generates a range, which can be seen on the graph as the black channel. When the market action breaches the range downwards, you could begin a short trade. Then, just above the top of the range, put a stop-loss order. When the RSI reaches the oversold zone, your trade must be closed.
Bottom line
To create positive and more validated trade signals, the RSI should be utilized in combination with other signals and technical characteristics. Furthermore, investors who are reluctant to commit a significant amount of time to analyze charts of numerous securities may profit from the StockEdge mobile app’s scanning section.
It makes it easier to keep track of specific trade possibilities using the RSI indicator. On an EOD basis, the program also allows you to combine your relative strength index method with other signals, volumes, and market patterns to produce more verified alerts.
At Tokenhell, we help over 5,000 crypto companies amplify their content reach—and you can join them! For inquiries, reach out to us at info@tokenhell.com. Please remember, cryptocurrencies are highly volatile assets. Always conduct thorough research before making any investment decisions. Some content on this website, including posts under Crypto Cable, Sponsored Articles, and Press Releases, is provided by guest contributors or paid sponsors. The views expressed in these posts do not necessarily represent the opinions of Tokenhell. We are not responsible for the accuracy, quality, or reliability of any third-party content, advertisements, products, or banners featured on this site. For more details, please review our full terms and conditions / disclaimer.

